Celtic vs Immigrants from Iraq Wage/Income Gap
COMPARE
Celtic
Immigrants from Iraq
Wage/Income Gap
Wage/Income Gap Comparison
Celtics
Immigrants from Iraq
27.3%
WAGE/INCOME GAP
2.8/ 100
METRIC RATING
247th/ 347
METRIC RANK
26.7%
WAGE/INCOME GAP
10.3/ 100
METRIC RATING
213th/ 347
METRIC RANK
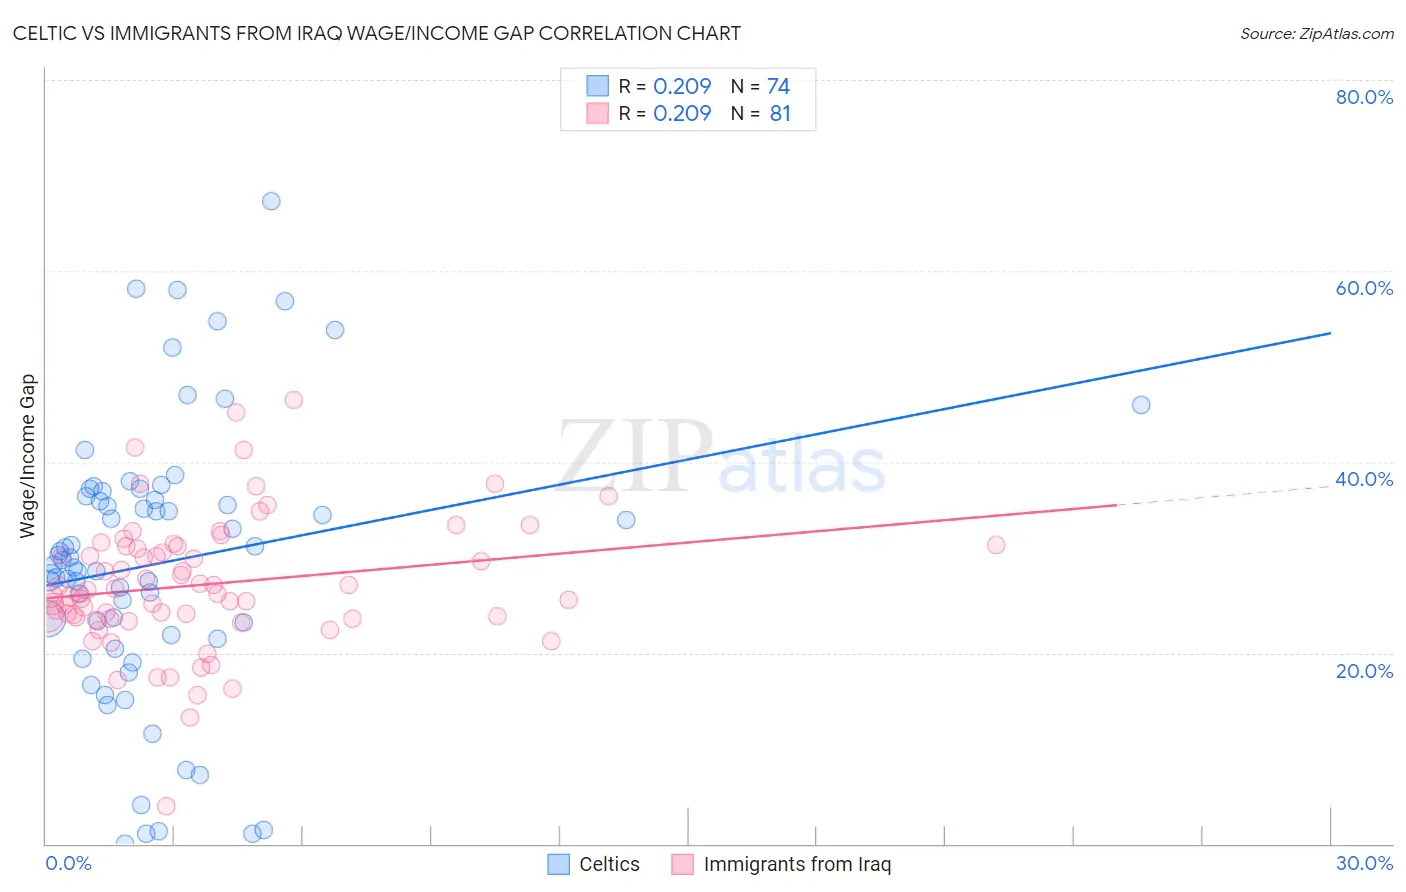
Celtic vs Immigrants from Iraq Wage/Income Gap Correlation Chart
The statistical analysis conducted on geographies consisting of 168,805,315 people shows a weak positive correlation between the proportion of Celtics and wage/income gap percentage in the United States with a correlation coefficient (R) of 0.209 and weighted average of 27.3%. Similarly, the statistical analysis conducted on geographies consisting of 194,737,327 people shows a weak positive correlation between the proportion of Immigrants from Iraq and wage/income gap percentage in the United States with a correlation coefficient (R) of 0.209 and weighted average of 26.7%, a difference of 2.2%.
Wage/Income Gap Correlation Summary
| Measurement | Celtic | Immigrants from Iraq |
| Minimum | 0.040% | 3.9% |
| Maximum | 67.3% | 46.5% |
| Range | 67.3% | 42.6% |
| Mean | 29.4% | 27.1% |
| Median | 29.5% | 26.2% |
| Interquartile 25% (IQ1) | 21.9% | 23.7% |
| Interquartile 75% (IQ3) | 36.4% | 31.2% |
| Interquartile Range (IQR) | 14.5% | 7.5% |
| Standard Deviation (Sample) | 14.3% | 6.9% |
| Standard Deviation (Population) | 14.2% | 6.9% |
Similar Demographics by Wage/Income Gap
Demographics Similar to Celtics by Wage/Income Gap
In terms of wage/income gap, the demographic groups most similar to Celtics are Cypriot (27.3%, a difference of 0.010%), Carpatho Rusyn (27.3%, a difference of 0.020%), Immigrants from Czechoslovakia (27.3%, a difference of 0.030%), Immigrants from Norway (27.3%, a difference of 0.14%), and Ukrainian (27.3%, a difference of 0.20%).
| Demographics | Rating | Rank | Wage/Income Gap |
| Immigrants | Europe | 3.8 /100 | #240 | Tragic 27.1% |
| Creek | 3.8 /100 | #241 | Tragic 27.1% |
| Immigrants | Sri Lanka | 3.7 /100 | #242 | Tragic 27.1% |
| Spanish | 3.6 /100 | #243 | Tragic 27.1% |
| Chickasaw | 3.5 /100 | #244 | Tragic 27.2% |
| Immigrants | Azores | 3.5 /100 | #245 | Tragic 27.2% |
| Immigrants | Nonimmigrants | 3.3 /100 | #246 | Tragic 27.2% |
| Celtics | 2.8 /100 | #247 | Tragic 27.3% |
| Cypriots | 2.8 /100 | #248 | Tragic 27.3% |
| Carpatho Rusyns | 2.7 /100 | #249 | Tragic 27.3% |
| Immigrants | Czechoslovakia | 2.7 /100 | #250 | Tragic 27.3% |
| Immigrants | Norway | 2.5 /100 | #251 | Tragic 27.3% |
| Ukrainians | 2.4 /100 | #252 | Tragic 27.3% |
| Portuguese | 2.2 /100 | #253 | Tragic 27.4% |
| Israelis | 2.1 /100 | #254 | Tragic 27.4% |
Demographics Similar to Immigrants from Iraq by Wage/Income Gap
In terms of wage/income gap, the demographic groups most similar to Immigrants from Iraq are Immigrants from China (26.7%, a difference of 0.010%), Yugoslavian (26.7%, a difference of 0.10%), Iraqi (26.6%, a difference of 0.15%), Immigrants from Portugal (26.7%, a difference of 0.15%), and Mongolian (26.6%, a difference of 0.18%).
| Demographics | Rating | Rank | Wage/Income Gap |
| Indians (Asian) | 16.5 /100 | #206 | Poor 26.4% |
| Immigrants | Italy | 15.8 /100 | #207 | Poor 26.5% |
| Egyptians | 12.7 /100 | #208 | Poor 26.6% |
| Immigrants | Kuwait | 12.6 /100 | #209 | Poor 26.6% |
| Arabs | 12.3 /100 | #210 | Poor 26.6% |
| Mongolians | 11.4 /100 | #211 | Poor 26.6% |
| Iraqis | 11.2 /100 | #212 | Poor 26.6% |
| Immigrants | Iraq | 10.3 /100 | #213 | Poor 26.7% |
| Immigrants | China | 10.3 /100 | #214 | Poor 26.7% |
| Yugoslavians | 9.7 /100 | #215 | Tragic 26.7% |
| Immigrants | Portugal | 9.5 /100 | #216 | Tragic 26.7% |
| Brazilians | 9.2 /100 | #217 | Tragic 26.7% |
| Immigrants | Saudi Arabia | 9.1 /100 | #218 | Tragic 26.7% |
| Immigrants | Poland | 8.9 /100 | #219 | Tragic 26.7% |
| Immigrants | Latvia | 8.9 /100 | #220 | Tragic 26.7% |