Zip Codes with the Highest Percentage of Population Employed in Professional & Scientific Services in Mishawaka, IN
RELATED REPORTS & OPTIONS
Professional & Scientific Services
Mishawaka
Compare Zip Codes
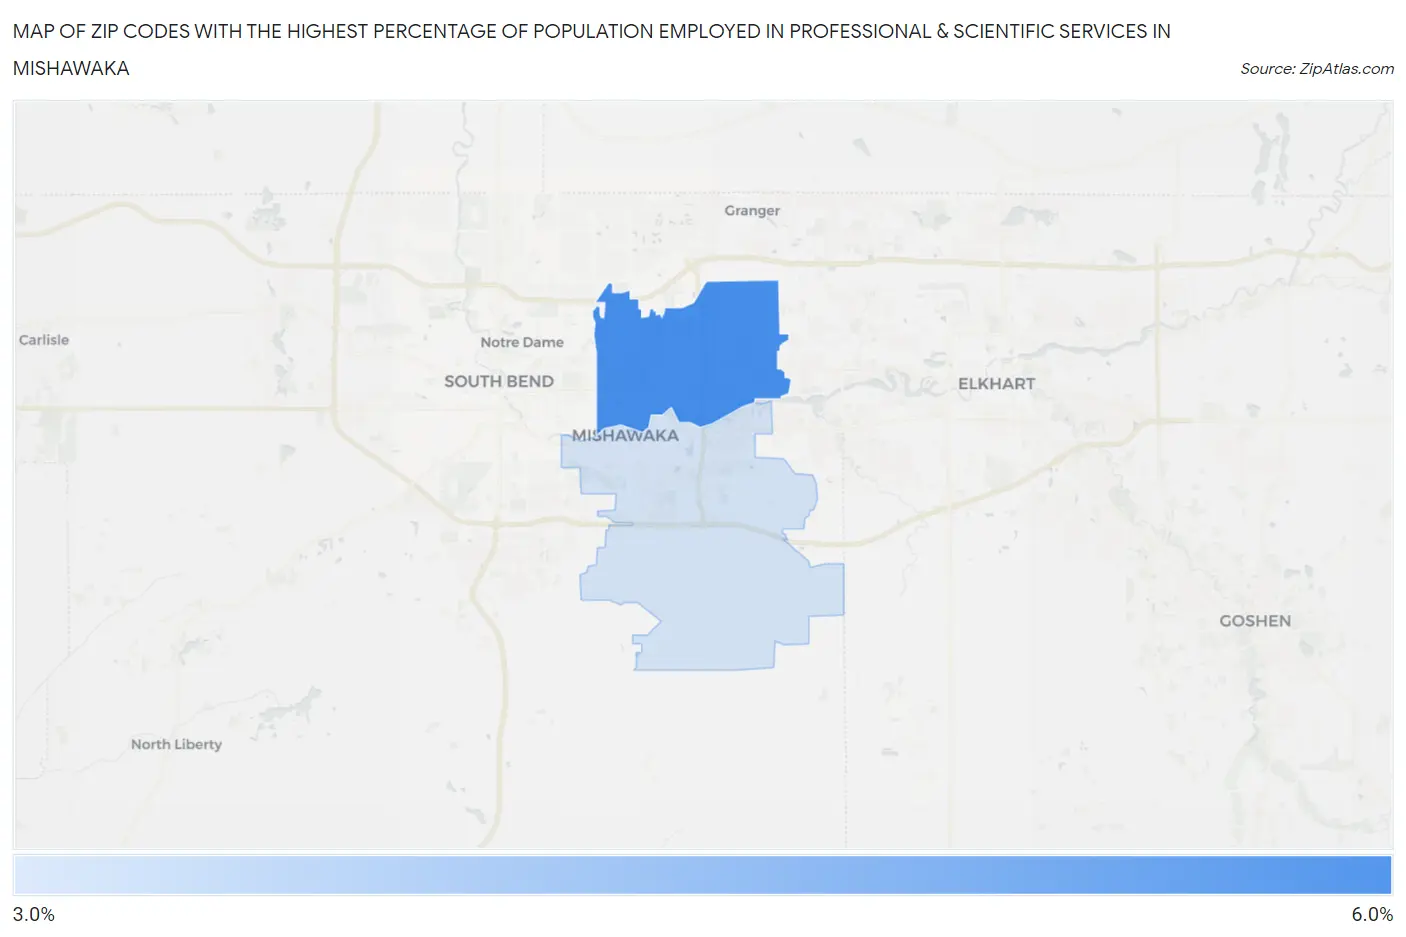
Map of Zip Codes with the Highest Percentage of Population Employed in Professional & Scientific Services in Mishawaka
0.0%
6.0%
Zip Codes with the Highest Percentage of Population Employed in Professional & Scientific Services in Mishawaka, IN
| Zip Code | % Employed | vs State | vs National | |
| 1. | 46545 | 5.1% | 5.1%(-0.009)#180 | 7.8%(-2.71)#11,972 |
| 2. | 46544 | 3.9% | 5.1%(-1.25)#268 | 7.8%(-3.95)#15,410 |
1
Common Questions
What are the Top Zip Codes with the Highest Percentage of Population Employed in Professional & Scientific Services in Mishawaka, IN?
Top Zip Codes with the Highest Percentage of Population Employed in Professional & Scientific Services in Mishawaka, IN are:
What zip code has the Highest Percentage of Population Employed in Professional & Scientific Services in Mishawaka, IN?
46545 has the Highest Percentage of Population Employed in Professional & Scientific Services in Mishawaka, IN with 5.1%.
What is the Percentage of Population Employed in Professional & Scientific Services in Mishawaka, IN?
Percentage of Population Employed in Professional & Scientific Services in Mishawaka is 4.4%.
What is the Percentage of Population Employed in Professional & Scientific Services in Indiana?
Percentage of Population Employed in Professional & Scientific Services in Indiana is 5.1%.
What is the Percentage of Population Employed in Professional & Scientific Services in the United States?
Percentage of Population Employed in Professional & Scientific Services in the United States is 7.8%.