Zip Codes with the Highest Percentage of Households Heated by Bottled Gas / Liquid Propane in Mishawaka, IN
RELATED REPORTS & OPTIONS
Bottled Gas / LP Heating
Mishawaka
Compare Zip Codes
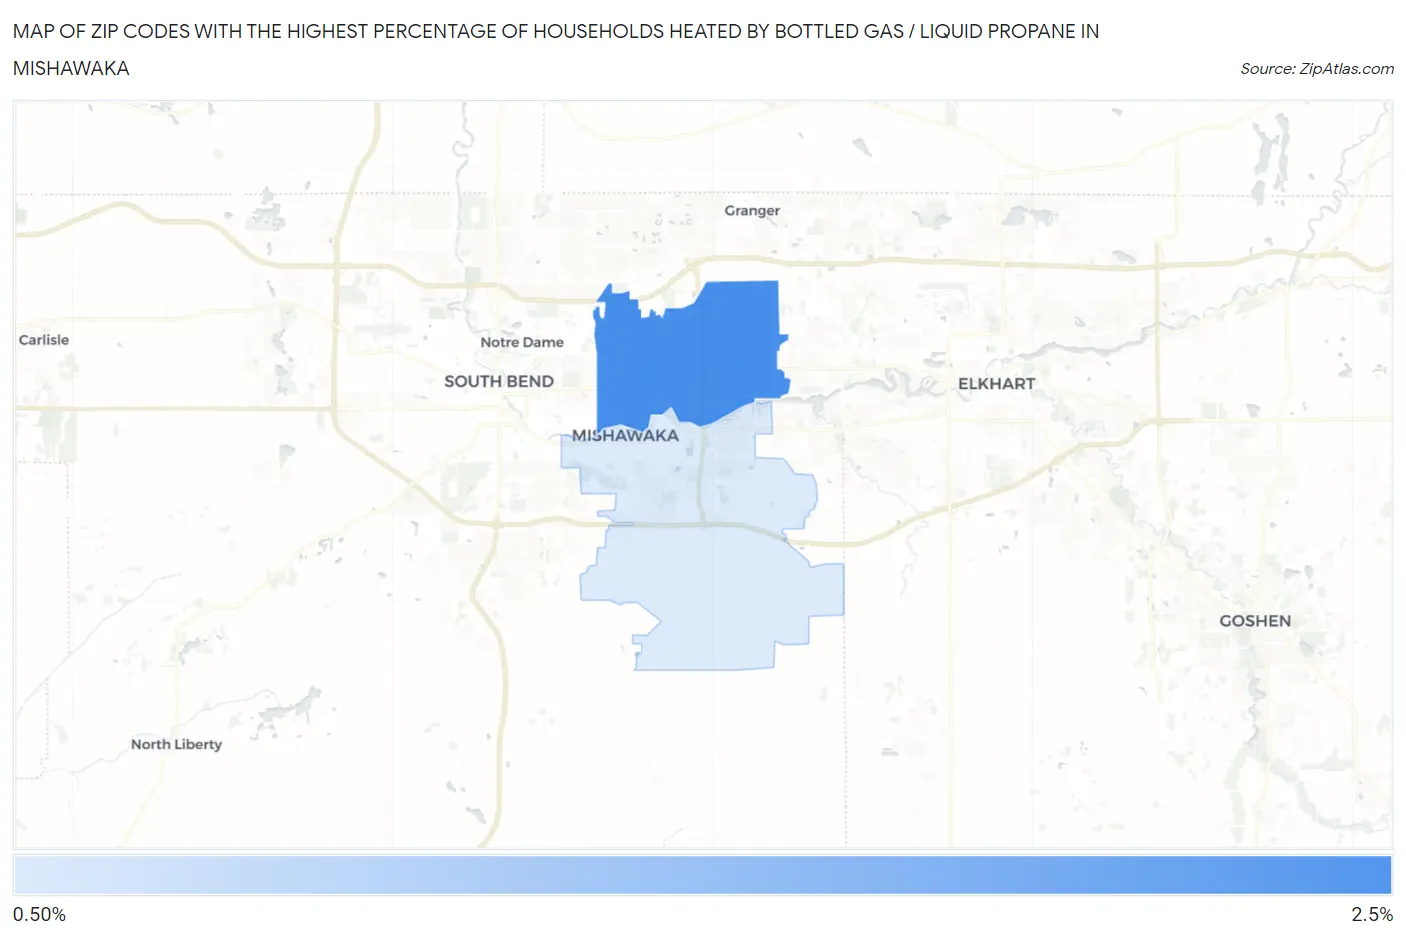
Map of Zip Codes with the Highest Percentage of Households Heated by Bottled Gas / Liquid Propane in Mishawaka
0.0%
2.5%
Zip Codes with the Highest Percentage of Households Heated by Bottled Gas / Liquid Propane in Mishawaka, IN
| Zip Code | Bottled Gas / LP Heating | vs State | vs National | |
| 1. | 46545 | 2.3% | 7.3%(-5.00)#594 | 4.9%(-2.60)#22,408 |
| 2. | 46544 | 1.0% | 7.3%(-6.30)#675 | 4.9%(-3.90)#26,651 |
1
Common Questions
What are the Top Zip Codes with the Highest Percentage of Households Heated by Bottled Gas / Liquid Propane in Mishawaka, IN?
Top Zip Codes with the Highest Percentage of Households Heated by Bottled Gas / Liquid Propane in Mishawaka, IN are:
What zip code has the Highest Percentage of Households Heated by Bottled Gas / Liquid Propane in Mishawaka, IN?
46545 has the Highest Percentage of Households Heated by Bottled Gas / Liquid Propane in Mishawaka, IN with 2.3%.
What is the Percentage of Households Heated by Bottled Gas / Liquid Propane in Mishawaka, IN?
Percentage of Households Heated by Bottled Gas / Liquid Propane in Mishawaka is 1.4%.
What is the Percentage of Households Heated by Bottled Gas / Liquid Propane in Indiana?
Percentage of Households Heated by Bottled Gas / Liquid Propane in Indiana is 7.3%.
What is the Percentage of Households Heated by Bottled Gas / Liquid Propane in the United States?
Percentage of Households Heated by Bottled Gas / Liquid Propane in the United States is 4.9%.