Zip Codes with the Highest Percentage of Population Employed in Transportation & Warehousing in Indianapolis, IN
RELATED REPORTS & OPTIONS
Transportation & Warehousing
Indianapolis
Compare Zip Codes
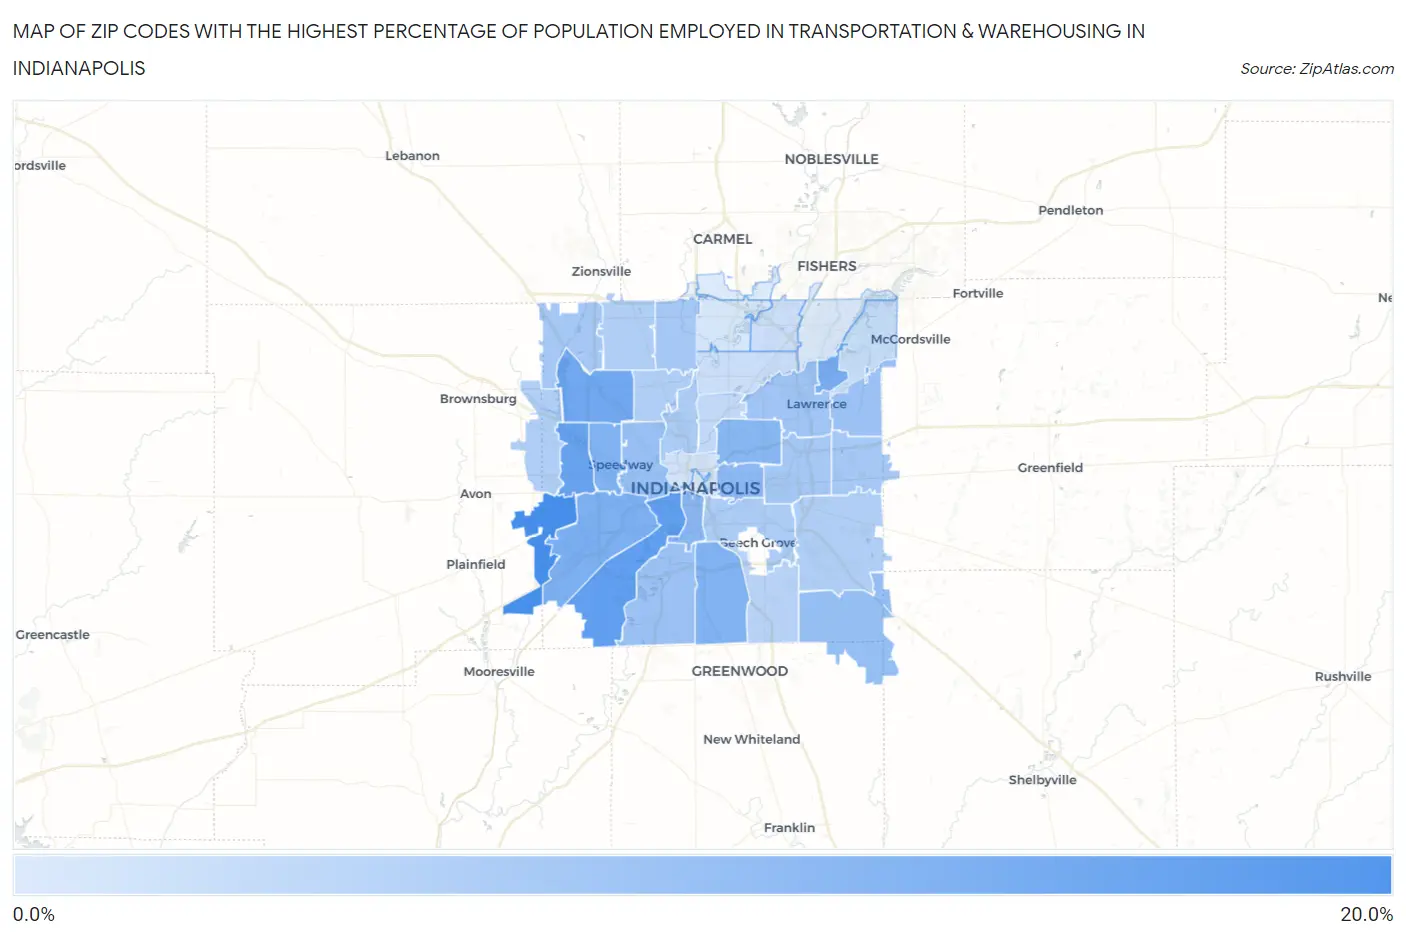
Map of Zip Codes with the Highest Percentage of Population Employed in Transportation & Warehousing in Indianapolis
0.0%
20.0%
Zip Codes with the Highest Percentage of Population Employed in Transportation & Warehousing in Indianapolis, IN
| Zip Code | % Employed | vs State | vs National | |
| 1. | 46231 | 17.3% | 5.1%(+12.2)#18 | 4.9%(+12.4)#736 |
| 2. | 46221 | 14.5% | 5.1%(+9.33)#26 | 4.9%(+9.53)#1,170 |
| 3. | 46214 | 13.7% | 5.1%(+8.60)#32 | 4.9%(+8.79)#1,335 |
| 4. | 46254 | 12.8% | 5.1%(+7.71)#37 | 4.9%(+7.90)#1,576 |
| 5. | 46216 | 12.0% | 5.1%(+6.85)#42 | 4.9%(+7.04)#1,863 |
| 6. | 46241 | 11.5% | 5.1%(+6.40)#45 | 4.9%(+6.60)#2,054 |
| 7. | 46224 | 11.2% | 5.1%(+6.11)#52 | 4.9%(+6.30)#2,207 |
| 8. | 46227 | 11.1% | 5.1%(+5.93)#54 | 4.9%(+6.13)#2,290 |
| 9. | 46218 | 10.4% | 5.1%(+5.21)#63 | 4.9%(+5.41)#2,672 |
| 10. | 46225 | 10.3% | 5.1%(+5.15)#65 | 4.9%(+5.35)#2,709 |
| 11. | 46201 | 9.9% | 5.1%(+4.80)#69 | 4.9%(+5.00)#2,931 |
| 12. | 46259 | 9.1% | 5.1%(+3.97)#82 | 4.9%(+4.17)#3,577 |
| 13. | 46222 | 8.7% | 5.1%(+3.59)#94 | 4.9%(+3.79)#4,009 |
| 14. | 46217 | 8.3% | 5.1%(+3.18)#105 | 4.9%(+3.38)#4,485 |
| 15. | 46235 | 8.3% | 5.1%(+3.13)#109 | 4.9%(+3.33)#4,546 |
| 16. | 46226 | 7.9% | 5.1%(+2.74)#119 | 4.9%(+2.93)#5,062 |
| 17. | 46229 | 7.4% | 5.1%(+2.30)#136 | 4.9%(+2.49)#5,757 |
| 18. | 46278 | 7.4% | 5.1%(+2.29)#137 | 4.9%(+2.48)#5,775 |
| 19. | 46219 | 7.4% | 5.1%(+2.21)#144 | 4.9%(+2.40)#5,907 |
| 20. | 46260 | 7.3% | 5.1%(+2.18)#146 | 4.9%(+2.38)#5,960 |
| 21. | 46208 | 6.7% | 5.1%(+1.57)#172 | 4.9%(+1.77)#7,121 |
| 22. | 46203 | 6.6% | 5.1%(+1.50)#176 | 4.9%(+1.69)#7,294 |
| 23. | 46239 | 6.3% | 5.1%(+1.20)#191 | 4.9%(+1.40)#7,942 |
| 24. | 46234 | 6.2% | 5.1%(+1.08)#201 | 4.9%(+1.27)#8,243 |
| 25. | 46268 | 6.2% | 5.1%(+1.06)#204 | 4.9%(+1.25)#8,280 |
| 26. | 46228 | 6.2% | 5.1%(+1.05)#208 | 4.9%(+1.25)#8,307 |
| 27. | 46237 | 5.6% | 5.1%(+0.455)#251 | 4.9%(+0.651)#9,968 |
| 28. | 46205 | 4.6% | 5.1%(-0.557)#344 | 4.9%(-0.361)#13,459 |
| 29. | 46236 | 4.2% | 5.1%(-0.935)#383 | 4.9%(-0.739)#14,989 |
| 30. | 46220 | 3.8% | 5.1%(-1.31)#423 | 4.9%(-1.11)#16,639 |
| 31. | 46250 | 3.8% | 5.1%(-1.38)#435 | 4.9%(-1.19)#16,977 |
| 32. | 46202 | 3.2% | 5.1%(-1.99)#494 | 4.9%(-1.79)#19,558 |
| 33. | 46240 | 2.5% | 5.1%(-2.61)#577 | 4.9%(-2.41)#22,258 |
| 34. | 46204 | 2.2% | 5.1%(-2.96)#609 | 4.9%(-2.77)#23,629 |
| 35. | 46256 | 2.1% | 5.1%(-3.02)#613 | 4.9%(-2.83)#23,851 |
| 36. | 46280 | 2.0% | 5.1%(-3.19)#620 | 4.9%(-2.99)#24,412 |
1
Common Questions
What are the Top 10 Zip Codes with the Highest Percentage of Population Employed in Transportation & Warehousing in Indianapolis, IN?
Top 10 Zip Codes with the Highest Percentage of Population Employed in Transportation & Warehousing in Indianapolis, IN are:
What zip code has the Highest Percentage of Population Employed in Transportation & Warehousing in Indianapolis, IN?
46231 has the Highest Percentage of Population Employed in Transportation & Warehousing in Indianapolis, IN with 17.3%.
What is the Percentage of Population Employed in Transportation & Warehousing in Indianapolis, IN?
Percentage of Population Employed in Transportation & Warehousing in Indianapolis is 8.0%.
What is the Percentage of Population Employed in Transportation & Warehousing in Indiana?
Percentage of Population Employed in Transportation & Warehousing in Indiana is 5.1%.
What is the Percentage of Population Employed in Transportation & Warehousing in the United States?
Percentage of Population Employed in Transportation & Warehousing in the United States is 4.9%.