Zip Codes with the Highest Percentage of Population Employed in Agriculture, Fishing & Hunting in Indianapolis, IN
RELATED REPORTS & OPTIONS
Agriculture, Fishing & Hunting
Indianapolis
Compare Zip Codes
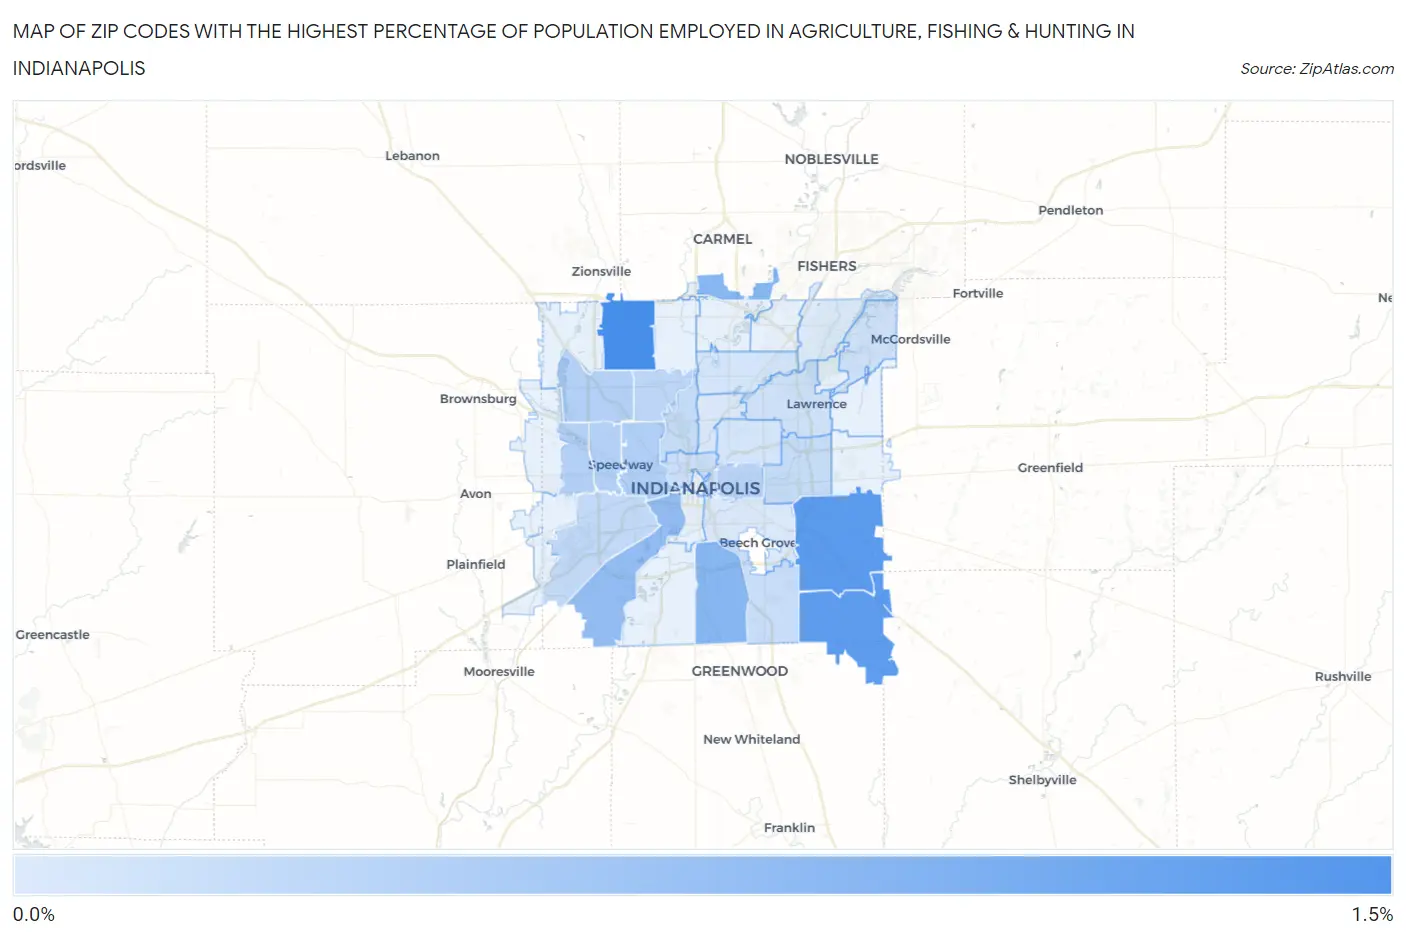
Map of Zip Codes with the Highest Percentage of Population Employed in Agriculture, Fishing & Hunting in Indianapolis
0.0%
1.5%
Zip Codes with the Highest Percentage of Population Employed in Agriculture, Fishing & Hunting in Indianapolis, IN
| Zip Code | % Employed | vs State | vs National | |
| 1. | 46268 | 1.4% | 1.1%(+0.316)#335 | 1.2%(+0.174)#14,748 |
| 2. | 46239 | 1.2% | 1.1%(+0.138)#359 | 1.2%(-0.005)#15,413 |
| 3. | 46259 | 1.2% | 1.1%(+0.109)#362 | 1.2%(-0.033)#15,536 |
| 4. | 46280 | 0.79% | 1.1%(-0.270)#415 | 1.2%(-0.413)#17,328 |
| 5. | 46227 | 0.77% | 1.1%(-0.284)#418 | 1.2%(-0.426)#17,402 |
| 6. | 46221 | 0.68% | 1.1%(-0.381)#436 | 1.2%(-0.523)#17,982 |
| 7. | 46222 | 0.41% | 1.1%(-0.650)#491 | 1.2%(-0.793)#20,091 |
| 8. | 46214 | 0.39% | 1.1%(-0.671)#494 | 1.2%(-0.813)#20,286 |
| 9. | 46224 | 0.38% | 1.1%(-0.672)#495 | 1.2%(-0.815)#20,297 |
| 10. | 46254 | 0.38% | 1.1%(-0.681)#501 | 1.2%(-0.824)#20,386 |
| 11. | 46201 | 0.34% | 1.1%(-0.714)#507 | 1.2%(-0.856)#20,715 |
| 12. | 46228 | 0.29% | 1.1%(-0.764)#520 | 1.2%(-0.906)#21,247 |
| 13. | 46241 | 0.25% | 1.1%(-0.802)#531 | 1.2%(-0.945)#21,714 |
| 14. | 46219 | 0.23% | 1.1%(-0.830)#541 | 1.2%(-0.973)#22,022 |
| 15. | 46208 | 0.22% | 1.1%(-0.835)#544 | 1.2%(-0.978)#22,085 |
| 16. | 46237 | 0.20% | 1.1%(-0.859)#547 | 1.2%(-1.00)#22,389 |
| 17. | 46202 | 0.18% | 1.1%(-0.882)#554 | 1.2%(-1.02)#22,653 |
| 18. | 46226 | 0.14% | 1.1%(-0.917)#568 | 1.2%(-1.06)#23,160 |
| 19. | 46236 | 0.13% | 1.1%(-0.927)#574 | 1.2%(-1.07)#23,283 |
| 20. | 46220 | 0.091% | 1.1%(-0.966)#584 | 1.2%(-1.11)#23,809 |
| 21. | 46218 | 0.086% | 1.1%(-0.971)#585 | 1.2%(-1.11)#23,885 |
| 22. | 46205 | 0.045% | 1.1%(-1.01)#591 | 1.2%(-1.15)#24,401 |
| 23. | 46203 | 0.034% | 1.1%(-1.02)#594 | 1.2%(-1.17)#24,506 |
| 24. | 46256 | 0.0083% | 1.1%(-1.05)#596 | 1.2%(-1.19)#24,626 |
1
Common Questions
What are the Top 10 Zip Codes with the Highest Percentage of Population Employed in Agriculture, Fishing & Hunting in Indianapolis, IN?
Top 10 Zip Codes with the Highest Percentage of Population Employed in Agriculture, Fishing & Hunting in Indianapolis, IN are:
What zip code has the Highest Percentage of Population Employed in Agriculture, Fishing & Hunting in Indianapolis, IN?
46268 has the Highest Percentage of Population Employed in Agriculture, Fishing & Hunting in Indianapolis, IN with 1.4%.
What is the Percentage of Population Employed in Agriculture, Fishing & Hunting in Indianapolis, IN?
Percentage of Population Employed in Agriculture, Fishing & Hunting in Indianapolis is 0.29%.
What is the Percentage of Population Employed in Agriculture, Fishing & Hunting in Indiana?
Percentage of Population Employed in Agriculture, Fishing & Hunting in Indiana is 1.1%.
What is the Percentage of Population Employed in Agriculture, Fishing & Hunting in the United States?
Percentage of Population Employed in Agriculture, Fishing & Hunting in the United States is 1.2%.