Zip Codes with the Highest Percentage of Population Employed in Agriculture, Fishing & Hunting in Goshen, IN
RELATED REPORTS & OPTIONS
Agriculture, Fishing & Hunting
Goshen
Compare Zip Codes
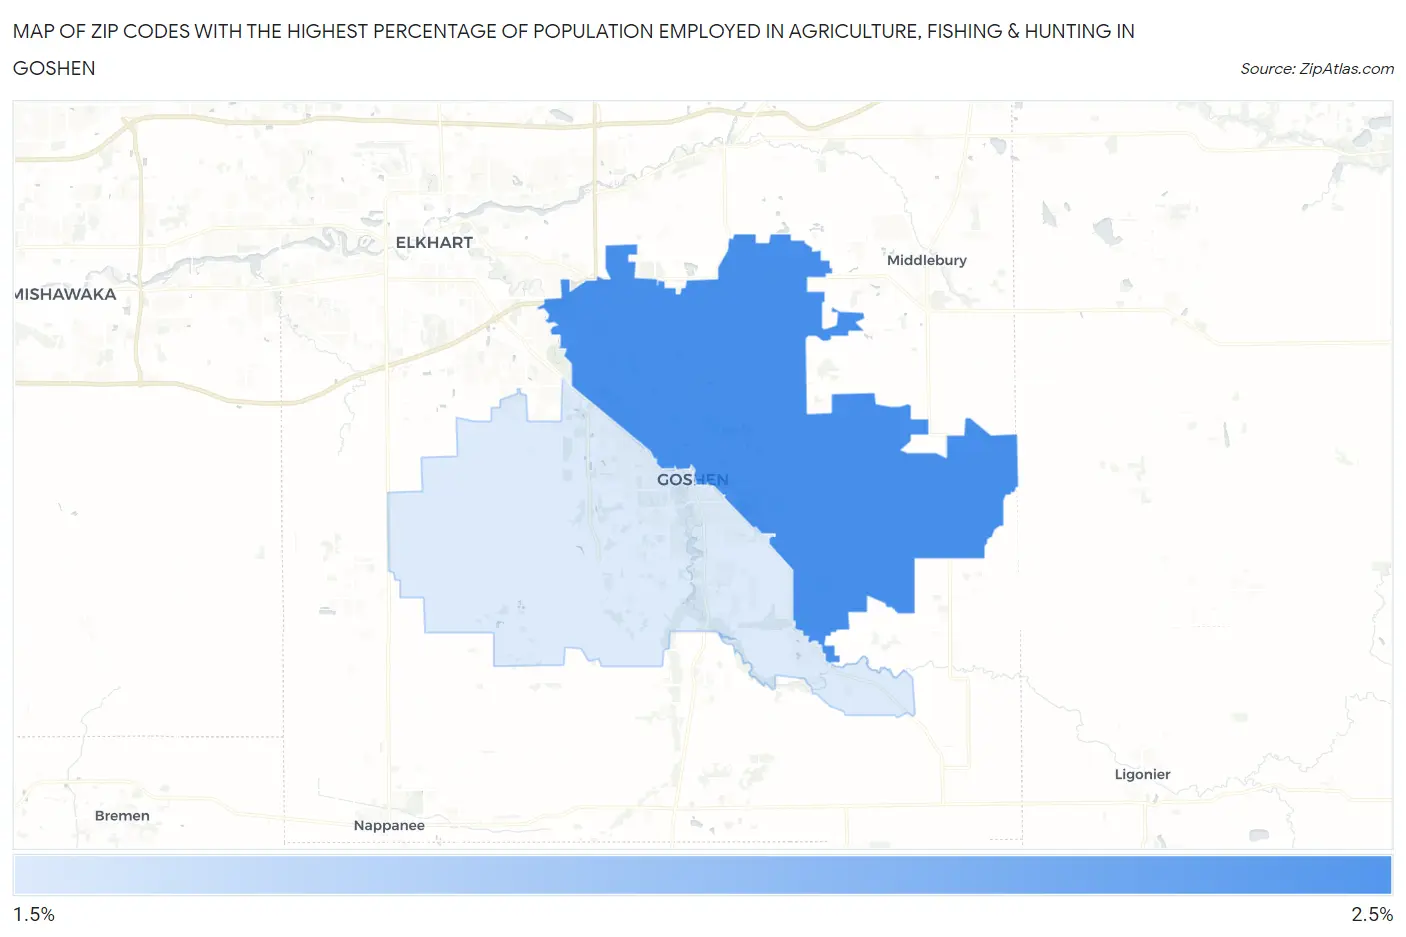
Map of Zip Codes with the Highest Percentage of Population Employed in Agriculture, Fishing & Hunting in Goshen
1.6%
2.4%
Zip Codes with the Highest Percentage of Population Employed in Agriculture, Fishing & Hunting in Goshen, IN
| Zip Code | % Employed | vs State | vs National | |
| 1. | 46528 | 2.4% | 1.1%(+1.33)#244 | 1.2%(+1.19)#11,822 |
| 2. | 46526 | 1.6% | 1.1%(+0.569)#314 | 1.2%(+0.427)#13,886 |
1
Common Questions
What are the Top Zip Codes with the Highest Percentage of Population Employed in Agriculture, Fishing & Hunting in Goshen, IN?
Top Zip Codes with the Highest Percentage of Population Employed in Agriculture, Fishing & Hunting in Goshen, IN are:
What zip code has the Highest Percentage of Population Employed in Agriculture, Fishing & Hunting in Goshen, IN?
46528 has the Highest Percentage of Population Employed in Agriculture, Fishing & Hunting in Goshen, IN with 2.4%.
What is the Percentage of Population Employed in Agriculture, Fishing & Hunting in Goshen, IN?
Percentage of Population Employed in Agriculture, Fishing & Hunting in Goshen is 0.17%.
What is the Percentage of Population Employed in Agriculture, Fishing & Hunting in Indiana?
Percentage of Population Employed in Agriculture, Fishing & Hunting in Indiana is 1.1%.
What is the Percentage of Population Employed in Agriculture, Fishing & Hunting in the United States?
Percentage of Population Employed in Agriculture, Fishing & Hunting in the United States is 1.2%.