Zip Codes with the Highest Percentage of Population Employed in Agriculture, Fishing & Hunting in Noblesville, IN
RELATED REPORTS & OPTIONS
Agriculture, Fishing & Hunting
Noblesville
Compare Zip Codes
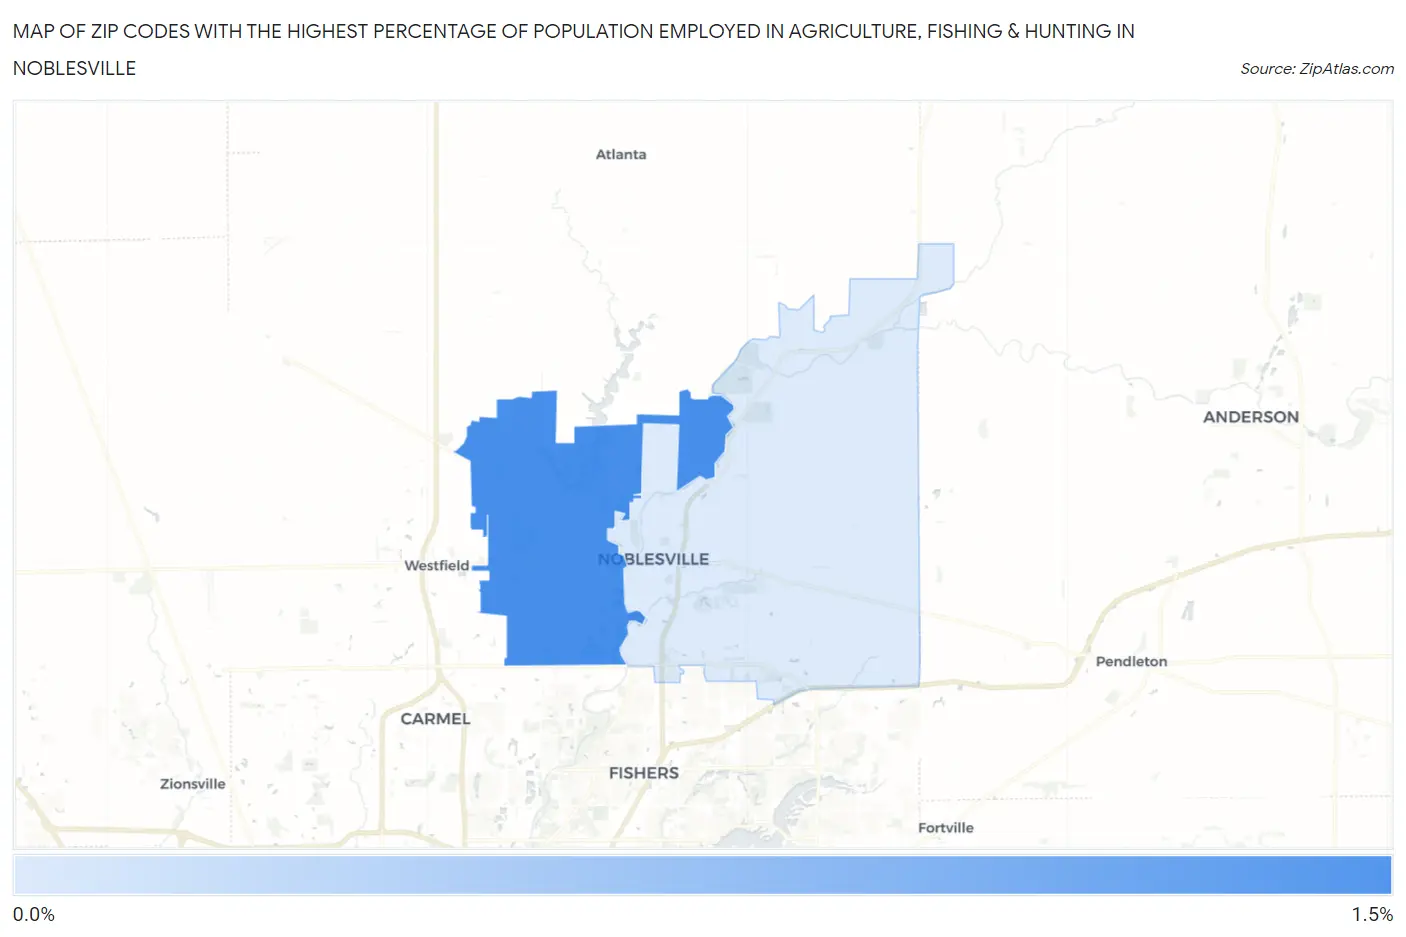
Map of Zip Codes with the Highest Percentage of Population Employed in Agriculture, Fishing & Hunting in Noblesville
0.47%
1.0%
Zip Codes with the Highest Percentage of Population Employed in Agriculture, Fishing & Hunting in Noblesville, IN
| Zip Code | % Employed | vs State | vs National | |
| 1. | 46062 | 1.0% | 1.1%(-0.034)#383 | 1.2%(-0.177)#16,123 |
| 2. | 46060 | 0.47% | 1.1%(-0.590)#475 | 1.2%(-0.733)#19,566 |
1
Common Questions
What are the Top Zip Codes with the Highest Percentage of Population Employed in Agriculture, Fishing & Hunting in Noblesville, IN?
Top Zip Codes with the Highest Percentage of Population Employed in Agriculture, Fishing & Hunting in Noblesville, IN are:
What zip code has the Highest Percentage of Population Employed in Agriculture, Fishing & Hunting in Noblesville, IN?
46062 has the Highest Percentage of Population Employed in Agriculture, Fishing & Hunting in Noblesville, IN with 1.0%.
What is the Percentage of Population Employed in Agriculture, Fishing & Hunting in Noblesville, IN?
Percentage of Population Employed in Agriculture, Fishing & Hunting in Noblesville is 0.57%.
What is the Percentage of Population Employed in Agriculture, Fishing & Hunting in Indiana?
Percentage of Population Employed in Agriculture, Fishing & Hunting in Indiana is 1.1%.
What is the Percentage of Population Employed in Agriculture, Fishing & Hunting in the United States?
Percentage of Population Employed in Agriculture, Fishing & Hunting in the United States is 1.2%.