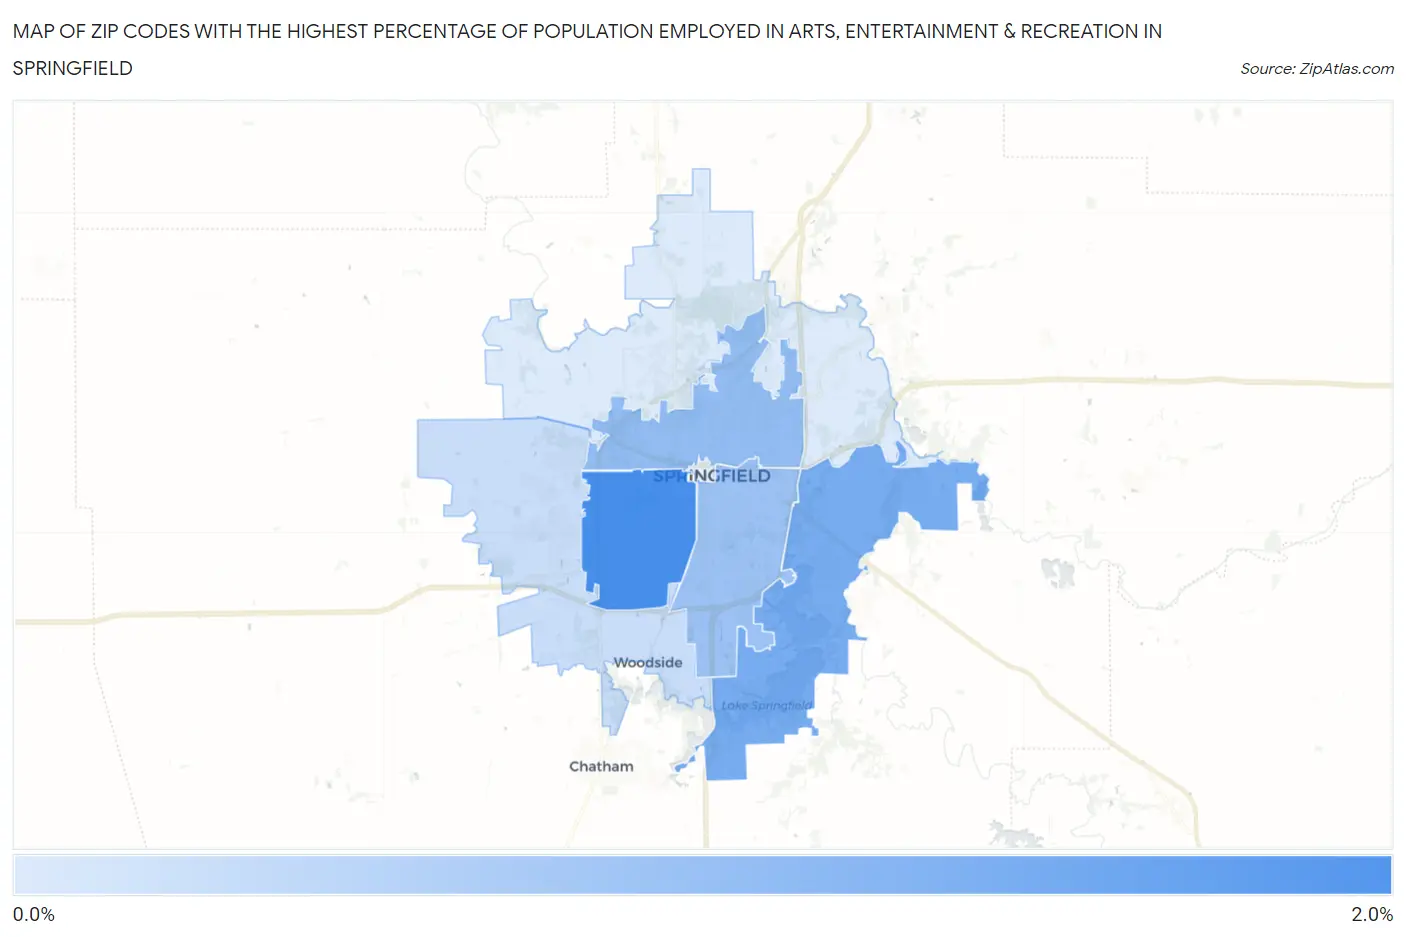
Zip Codes with the Highest Percentage of Population Employed in Arts, Entertainment & Recreation in Springfield, IL
RELATED REPORTS & OPTIONS
Arts, Entertainment & Recreation
Springfield
Compare Zip Codes
Map of Zip Codes with the Highest Percentage of Population Employed in Arts, Entertainment & Recreation in Springfield
0.0%
2.0%
Zip Codes with the Highest Percentage of Population Employed in Arts, Entertainment & Recreation in Springfield, IL
| Zip Code | % Employed | vs State | vs National | |
| 1. | 62704 | 2.0% | 1.9%(+0.052)#345 | 2.1%(-0.096)#9,861 |
| 2. | 62712 | 1.4% | 1.9%(-0.496)#509 | 2.1%(-0.644)#13,684 |
| 3. | 62702 | 1.1% | 1.9%(-0.811)#620 | 2.1%(-0.959)#16,052 |
| 4. | 62703 | 1.0% | 1.9%(-0.900)#647 | 2.1%(-1.05)#16,690 |
| 5. | 62711 | 0.54% | 1.9%(-1.39)#804 | 2.1%(-1.54)#20,232 |
| 6. | 62707 | 0.31% | 1.9%(-1.63)#892 | 2.1%(-1.77)#21,664 |
1
Common Questions
What are the Top 5 Zip Codes with the Highest Percentage of Population Employed in Arts, Entertainment & Recreation in Springfield, IL?
Top 5 Zip Codes with the Highest Percentage of Population Employed in Arts, Entertainment & Recreation in Springfield, IL are:
What zip code has the Highest Percentage of Population Employed in Arts, Entertainment & Recreation in Springfield, IL?
62704 has the Highest Percentage of Population Employed in Arts, Entertainment & Recreation in Springfield, IL with 2.0%.
What is the Percentage of Population Employed in Arts, Entertainment & Recreation in Springfield, IL?
Percentage of Population Employed in Arts, Entertainment & Recreation in Springfield is 1.4%.
What is the Percentage of Population Employed in Arts, Entertainment & Recreation in Illinois?
Percentage of Population Employed in Arts, Entertainment & Recreation in Illinois is 1.9%.
What is the Percentage of Population Employed in Arts, Entertainment & Recreation in the United States?
Percentage of Population Employed in Arts, Entertainment & Recreation in the United States is 2.1%.