Zip Codes with the Highest Percentage of Population Employed in Arts, Entertainment & Recreation in Wheaton, IL
RELATED REPORTS & OPTIONS
Arts, Entertainment & Recreation
Wheaton
Compare Zip Codes
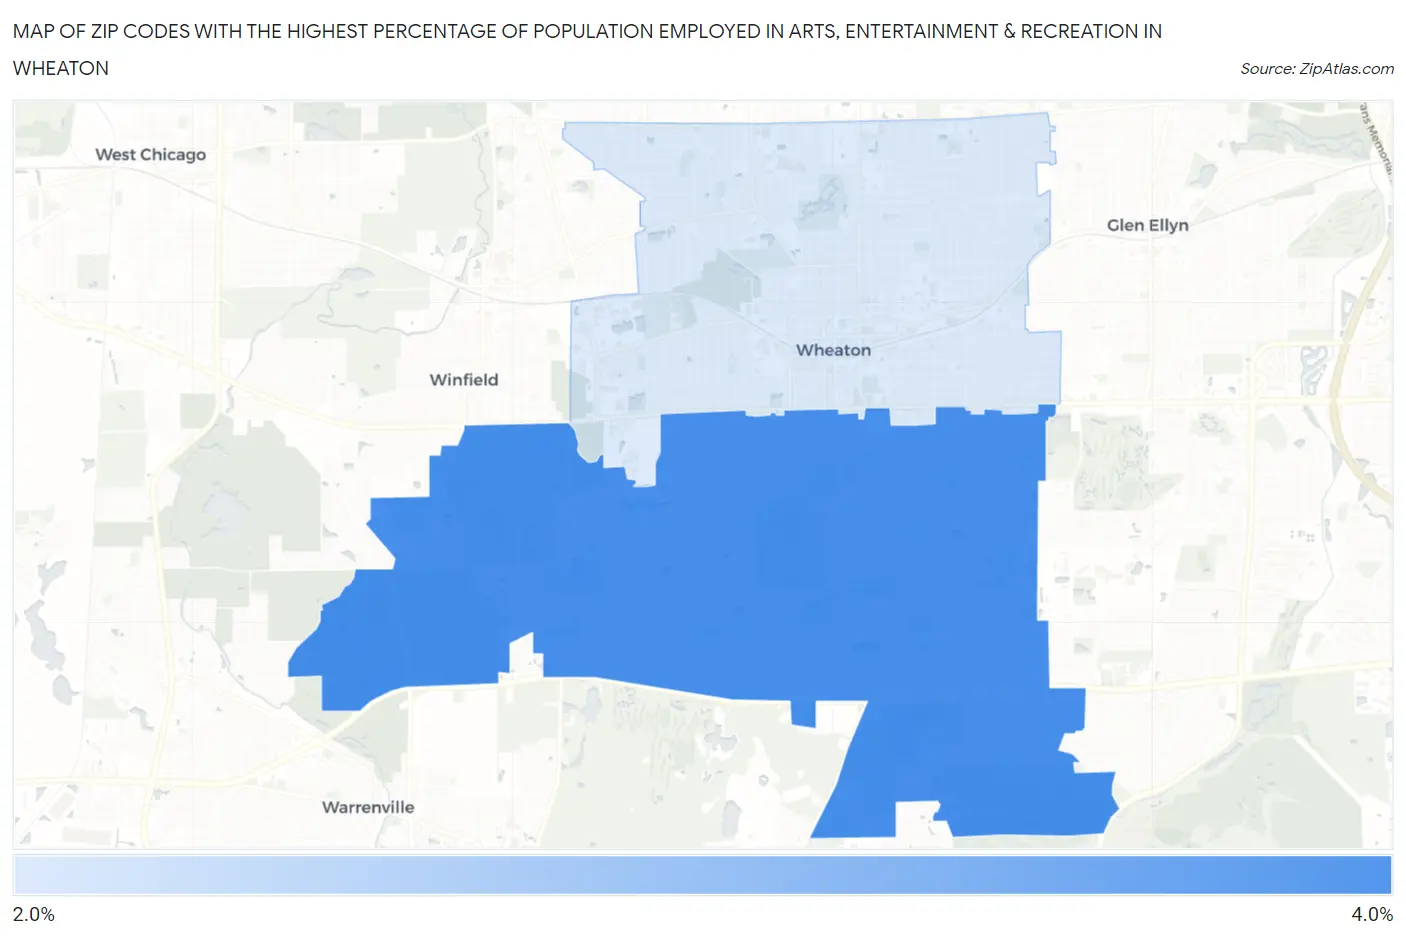
Map of Zip Codes with the Highest Percentage of Population Employed in Arts, Entertainment & Recreation in Wheaton
2.8%
3.3%
Zip Codes with the Highest Percentage of Population Employed in Arts, Entertainment & Recreation in Wheaton, IL
| Zip Code | % Employed | vs State | vs National | |
| 1. | 60189 | 3.3% | 1.9%(+1.40)#100 | 2.1%(+1.25)#4,506 |
| 2. | 60187 | 2.8% | 1.9%(+0.866)#164 | 2.1%(+0.718)#5,998 |
1
Common Questions
What are the Top Zip Codes with the Highest Percentage of Population Employed in Arts, Entertainment & Recreation in Wheaton, IL?
Top Zip Codes with the Highest Percentage of Population Employed in Arts, Entertainment & Recreation in Wheaton, IL are:
What zip code has the Highest Percentage of Population Employed in Arts, Entertainment & Recreation in Wheaton, IL?
60189 has the Highest Percentage of Population Employed in Arts, Entertainment & Recreation in Wheaton, IL with 3.3%.
What is the Percentage of Population Employed in Arts, Entertainment & Recreation in Wheaton, IL?
Percentage of Population Employed in Arts, Entertainment & Recreation in Wheaton is 3.0%.
What is the Percentage of Population Employed in Arts, Entertainment & Recreation in Illinois?
Percentage of Population Employed in Arts, Entertainment & Recreation in Illinois is 1.9%.
What is the Percentage of Population Employed in Arts, Entertainment & Recreation in the United States?
Percentage of Population Employed in Arts, Entertainment & Recreation in the United States is 2.1%.