Zip Codes with the Highest Percentage of Population Employed in Arts, Entertainment & Recreation in Tinley Park, IL
RELATED REPORTS & OPTIONS
Arts, Entertainment & Recreation
Tinley Park
Compare Zip Codes
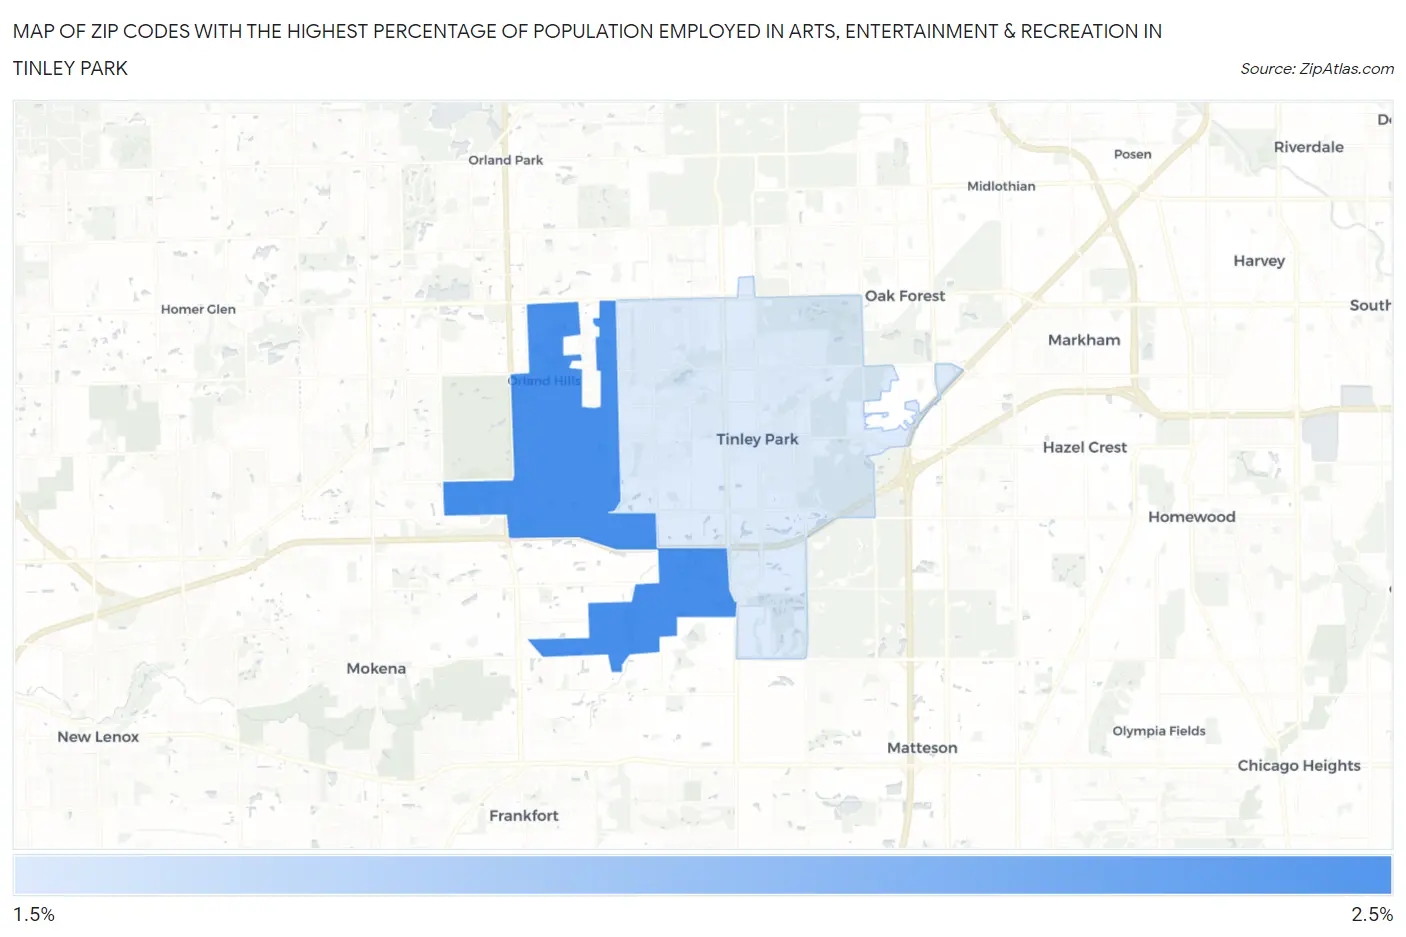
Map of Zip Codes with the Highest Percentage of Population Employed in Arts, Entertainment & Recreation in Tinley Park
1.6%
2.1%
Zip Codes with the Highest Percentage of Population Employed in Arts, Entertainment & Recreation in Tinley Park, IL
| Zip Code | % Employed | vs State | vs National | |
| 1. | 60487 | 2.1% | 1.9%(+0.128)#321 | 2.1%(-0.019)#9,416 |
| 2. | 60477 | 1.6% | 1.9%(-0.301)#451 | 2.1%(-0.449)#12,198 |
1
Common Questions
What are the Top Zip Codes with the Highest Percentage of Population Employed in Arts, Entertainment & Recreation in Tinley Park, IL?
Top Zip Codes with the Highest Percentage of Population Employed in Arts, Entertainment & Recreation in Tinley Park, IL are:
What zip code has the Highest Percentage of Population Employed in Arts, Entertainment & Recreation in Tinley Park, IL?
60487 has the Highest Percentage of Population Employed in Arts, Entertainment & Recreation in Tinley Park, IL with 2.1%.
What is the Percentage of Population Employed in Arts, Entertainment & Recreation in Tinley Park, IL?
Percentage of Population Employed in Arts, Entertainment & Recreation in Tinley Park is 1.8%.
What is the Percentage of Population Employed in Arts, Entertainment & Recreation in Illinois?
Percentage of Population Employed in Arts, Entertainment & Recreation in Illinois is 1.9%.
What is the Percentage of Population Employed in Arts, Entertainment & Recreation in the United States?
Percentage of Population Employed in Arts, Entertainment & Recreation in the United States is 2.1%.