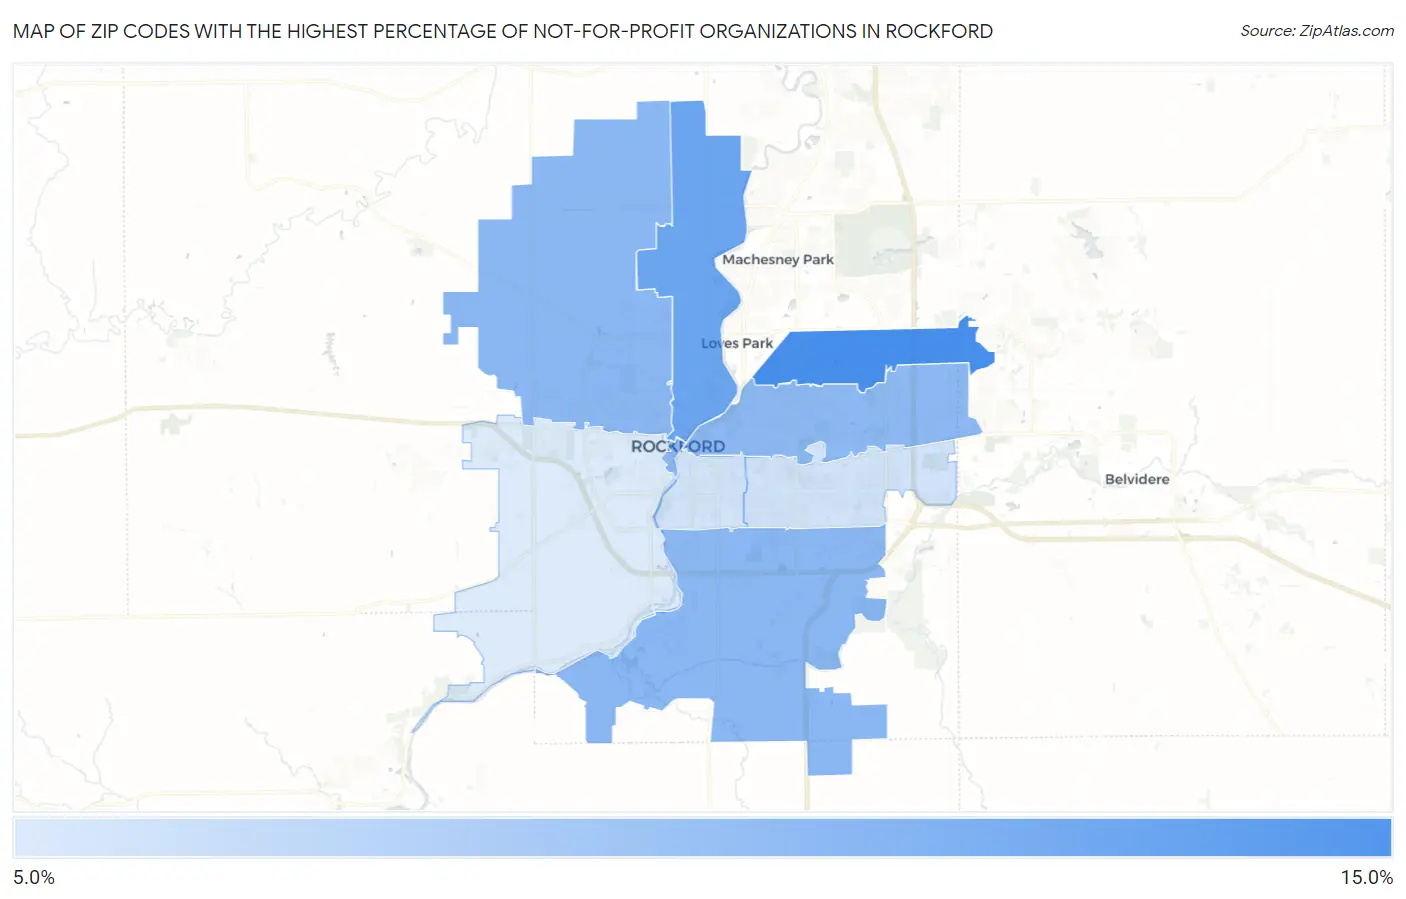
Zip Codes with the Highest Percentage of Not-for-profit Organizations in Rockford, IL
RELATED REPORTS & OPTIONS
Not-for-profit Organizations
Rockford
Compare Zip Codes
Map of Zip Codes with the Highest Percentage of Not-for-profit Organizations in Rockford
7.1%
11.6%
Zip Codes with the Highest Percentage of Not-for-profit Organizations in Rockford, IL
| Zip Code | % Employed in Not-for-profit | vs State | vs National | |
| 1. | 61114 | 11.6% | 9.3%(+2.31)#274 | 8.4%(+3.15)#6,193 |
| 2. | 61103 | 10.5% | 9.3%(+1.17)#376 | 8.4%(+2.01)#8,005 |
| 3. | 61101 | 9.6% | 9.3%(+0.300)#454 | 8.4%(+1.14)#9,784 |
| 4. | 61109 | 9.6% | 9.3%(+0.283)#457 | 8.4%(+1.12)#9,825 |
| 5. | 61107 | 9.5% | 9.3%(+0.178)#468 | 8.4%(+1.02)#10,042 |
| 6. | 61108 | 7.4% | 9.3%(-1.84)#711 | 8.4%(-1.00)#15,242 |
| 7. | 61104 | 7.4% | 9.3%(-1.85)#716 | 8.4%(-1.01)#15,271 |
| 8. | 61102 | 7.1% | 9.3%(-2.21)#762 | 8.4%(-1.37)#16,362 |
1
Common Questions
What are the Top 5 Zip Codes with the Highest Percentage of Not-for-profit Organizations in Rockford, IL?
Top 5 Zip Codes with the Highest Percentage of Not-for-profit Organizations in Rockford, IL are:
What zip code has the Highest Percentage of Not-for-profit Organizations in Rockford, IL?
61114 has the Highest Percentage of Not-for-profit Organizations in Rockford, IL with 11.6%.
What is the Percentage of Not-for-profit Organizations in Rockford, IL?
Percentage of Not-for-profit Organizations in Rockford is 9.4%.
What is the Percentage of Not-for-profit Organizations in Illinois?
Percentage of Not-for-profit Organizations in Illinois is 9.3%.
What is the Percentage of Not-for-profit Organizations in the United States?
Percentage of Not-for-profit Organizations in the United States is 8.4%.