Zip Codes with the Fewest Births per 1,000 Women Below Poverty Level in Rockford, IL

RELATED REPORTS & OPTIONS

Lowest Birth Rate | Below Poverty
Population
Families and Households
Female Fertility
Female Fertility (Unmarried)
Race (Community Size)
Race (Percentage)
Ancestry (Community Size)
AfricanAlbanianAlsatianAmericanApacheArabArgentineanArmenianAustralianAustrianBarbadianBelgianBelizeanBhutaneseBlackfeetBrazilianBritishBulgarianBurmeseCambodianCanadianCelticCentral AmericanCherokeeCheyenneChippewaChoctawColombianCroatianCubanCzechCzechoslovakianDanishDominicanDutchEastern EuropeanEcuadorianEgyptianEnglishEuropeanFinnishFrenchFrench CanadianGermanGhanaianGreekGuamanian / ChamorroGuatemalanHaitianHonduranHungarianIndian (Asian)IndonesianIraqiIrishItalianJamaicanJordanianKenyanKoreanLatvianLebaneseLithuanianLuxembourgerMalaysianMexicanMexican American IndianMoroccanNigerianNorthern EuropeanNorwegianPakistaniPennsylvania GermanPeruvianPolishPortuguesePotawatomiPuerto RicanRomanianRussianSalvadoranScandinavianScotch-IrishScottishSerbianSiouxSlovakSloveneSouth AmericanSpaniardSpanishSri LankanSubsaharan AfricanSwedishSwissThaiUkrainianWelshYugoslavian
Ancestry (Percentage)
AfricanAlbanianAlsatianAmericanApacheArabArgentineanArmenianAustralianAustrianBarbadianBelgianBelizeanBhutaneseBlackfeetBrazilianBritishBulgarianBurmeseCambodianCanadianCelticCentral AmericanCherokeeCheyenneChippewaChoctawColombianCroatianCubanCzechCzechoslovakianDanishDominicanDutchEastern EuropeanEcuadorianEgyptianEnglishEuropeanFinnishFrenchFrench CanadianGermanGhanaianGreekGuamanian / ChamorroGuatemalanHaitianHonduranHungarianIndian (Asian)IndonesianIraqiIrishItalianJamaicanJordanianKenyanKoreanLatvianLebaneseLithuanianLuxembourgerMalaysianMexicanMexican American IndianMoroccanNigerianNorthern EuropeanNorwegianPakistaniPennsylvania GermanPeruvianPolishPortuguesePotawatomiPuerto RicanRomanianRussianSalvadoranScandinavianScotch-IrishScottishSerbianSiouxSlovakSloveneSouth AmericanSpaniardSpanishSri LankanSubsaharan AfricanSwedishSwissThaiUkrainianWelshYugoslavian
Immigrant Origin (Total)
Immigrant Origin (Percentage)
Income
Income (Families)
Income (Households)
Poverty
Poverty (Families)
Unemployment
Employment Occupations
Employment Industries
Employer Class
Commute Time
Commute Means
School Enrollment
Education by Degree Field
Occupancy
Finances
Physical Characteristics
Rockford
Compare Zip Codes
Comparison Subject

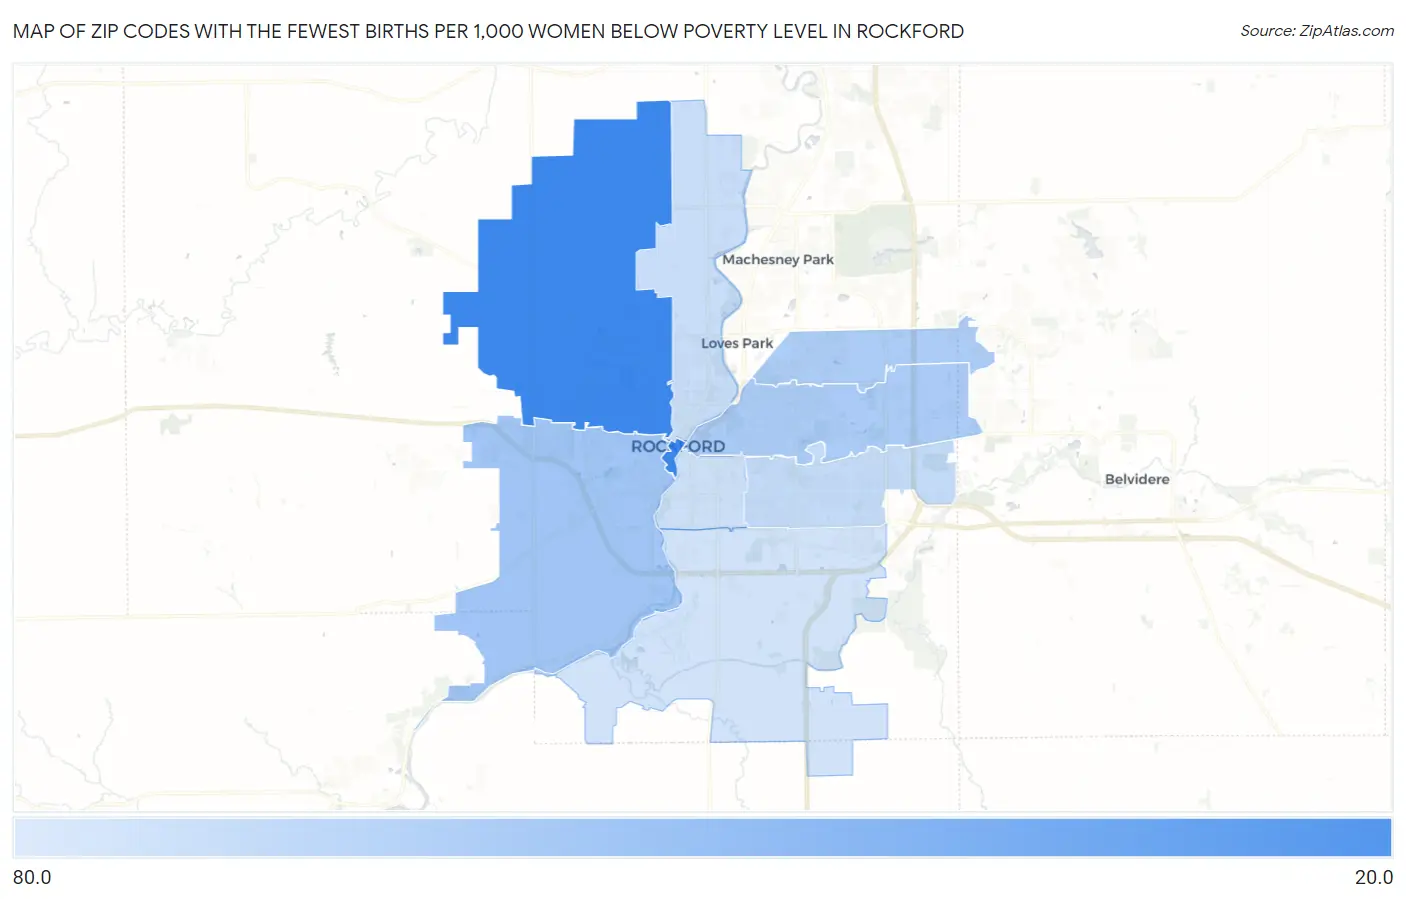
Map of Zip Codes with the Fewest Births per 1,000 Women Below Poverty Level in Rockford

80.0
0.0
Zip Codes with the Fewest Births per 1,000 Women Below Poverty Level in Rockford Map

Zip Codes with the Fewest Births per 1,000 Women Below Poverty Level in Rockford, IL

Zip Code Births / 1,000 Women vs State vs National
1.6110123.052.0(-29.0)#14153.0(-30.0)#2,944
2.6110254.052.0(+2.00)#58353.0(+1.000)#12,947
3.6110758.052.0(+6.00)#63553.0(+5.00)#14,136
4.6111459.052.0(+7.00)#65253.0(+6.00)#14,486
5.6110872.052.0(+20.0)#80853.0(+19.0)#17,738
6.6110374.052.0(+22.0)#82453.0(+21.0)#18,153
7.6110477.052.0(+25.0)#85753.0(+24.0)#18,709
8.6110980.052.0(+28.0)#88553.0(+27.0)#19,188

Common Questions

What are the Top 5 Zip Codes with the Fewest Births per 1,000 Women Below Poverty Level in Rockford, IL?
Top 5 Zip Codes with the Fewest Births per 1,000 Women Below Poverty Level in Rockford, IL are:
#1
23.0
#2
54.0
#3
58.0
#4
59.0
#5
72.0
What zip code has the Fewest Births per 1,000 Women Below Poverty Level in Rockford, IL?
61101 has the Fewest Births per 1,000 Women Below Poverty Level in Rockford, IL with 23.0.
What is the Number of Births per 1,000 Women Below Poverty Level in Rockford, IL?
Number of Births per 1,000 Women Below Poverty Level in Rockford is 67.0.
What is the Number of Births per 1,000 Women Below Poverty Level in Illinois?
Number of Births per 1,000 Women Below Poverty Level in Illinois is 52.0.
What is the Number of Births per 1,000 Women Below Poverty Level in the United States?
Number of Births per 1,000 Women Below Poverty Level in the United States is 53.0.