Zip Codes with the Highest Percentage of Population Employed in Arts, Entertainment & Recreation in Peoria, IL
RELATED REPORTS & OPTIONS
Arts, Entertainment & Recreation
Peoria
Compare Zip Codes
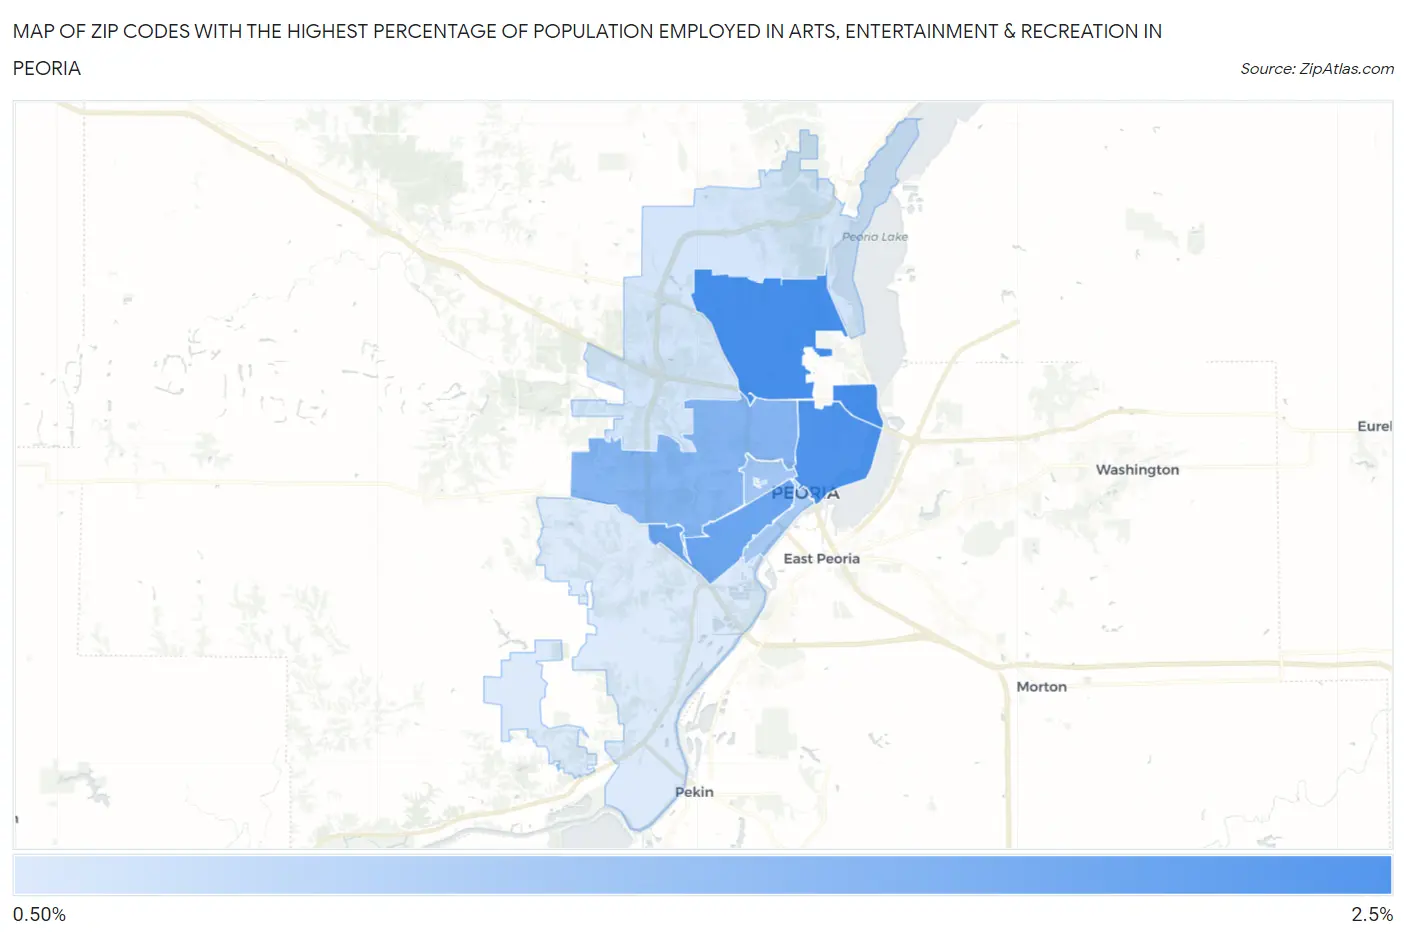
Map of Zip Codes with the Highest Percentage of Population Employed in Arts, Entertainment & Recreation in Peoria
0.0%
2.5%
Zip Codes with the Highest Percentage of Population Employed in Arts, Entertainment & Recreation in Peoria, IL
| Zip Code | % Employed | vs State | vs National | |
| 1. | 61614 | 2.2% | 1.9%(+0.313)#268 | 2.1%(+0.166)#8,386 |
| 2. | 61603 | 2.2% | 1.9%(+0.262)#282 | 2.1%(+0.114)#8,664 |
| 3. | 61605 | 2.0% | 1.9%(+0.090)#329 | 2.1%(-0.058)#9,629 |
| 4. | 61604 | 1.9% | 1.9%(-0.077)#374 | 2.1%(-0.225)#10,647 |
| 5. | 61606 | 1.7% | 1.9%(-0.262)#437 | 2.1%(-0.410)#11,924 |
| 6. | 61602 | 1.6% | 1.9%(-0.289)#446 | 2.1%(-0.436)#12,121 |
| 7. | 61615 | 1.4% | 1.9%(-0.557)#533 | 2.1%(-0.705)#14,150 |
| 8. | 61607 | 1.3% | 1.9%(-0.613)#551 | 2.1%(-0.760)#14,559 |
1
Common Questions
What are the Top 5 Zip Codes with the Highest Percentage of Population Employed in Arts, Entertainment & Recreation in Peoria, IL?
Top 5 Zip Codes with the Highest Percentage of Population Employed in Arts, Entertainment & Recreation in Peoria, IL are:
What zip code has the Highest Percentage of Population Employed in Arts, Entertainment & Recreation in Peoria, IL?
61614 has the Highest Percentage of Population Employed in Arts, Entertainment & Recreation in Peoria, IL with 2.2%.
What is the Percentage of Population Employed in Arts, Entertainment & Recreation in Peoria, IL?
Percentage of Population Employed in Arts, Entertainment & Recreation in Peoria is 1.9%.
What is the Percentage of Population Employed in Arts, Entertainment & Recreation in Illinois?
Percentage of Population Employed in Arts, Entertainment & Recreation in Illinois is 1.9%.
What is the Percentage of Population Employed in Arts, Entertainment & Recreation in the United States?
Percentage of Population Employed in Arts, Entertainment & Recreation in the United States is 2.1%.