Zip Codes with the Highest Percentage of Population Employed in Health Diagnosing & Treating in Carrollton, GA
RELATED REPORTS & OPTIONS
Health Diagnosing & Treating
Carrollton
Compare Zip Codes
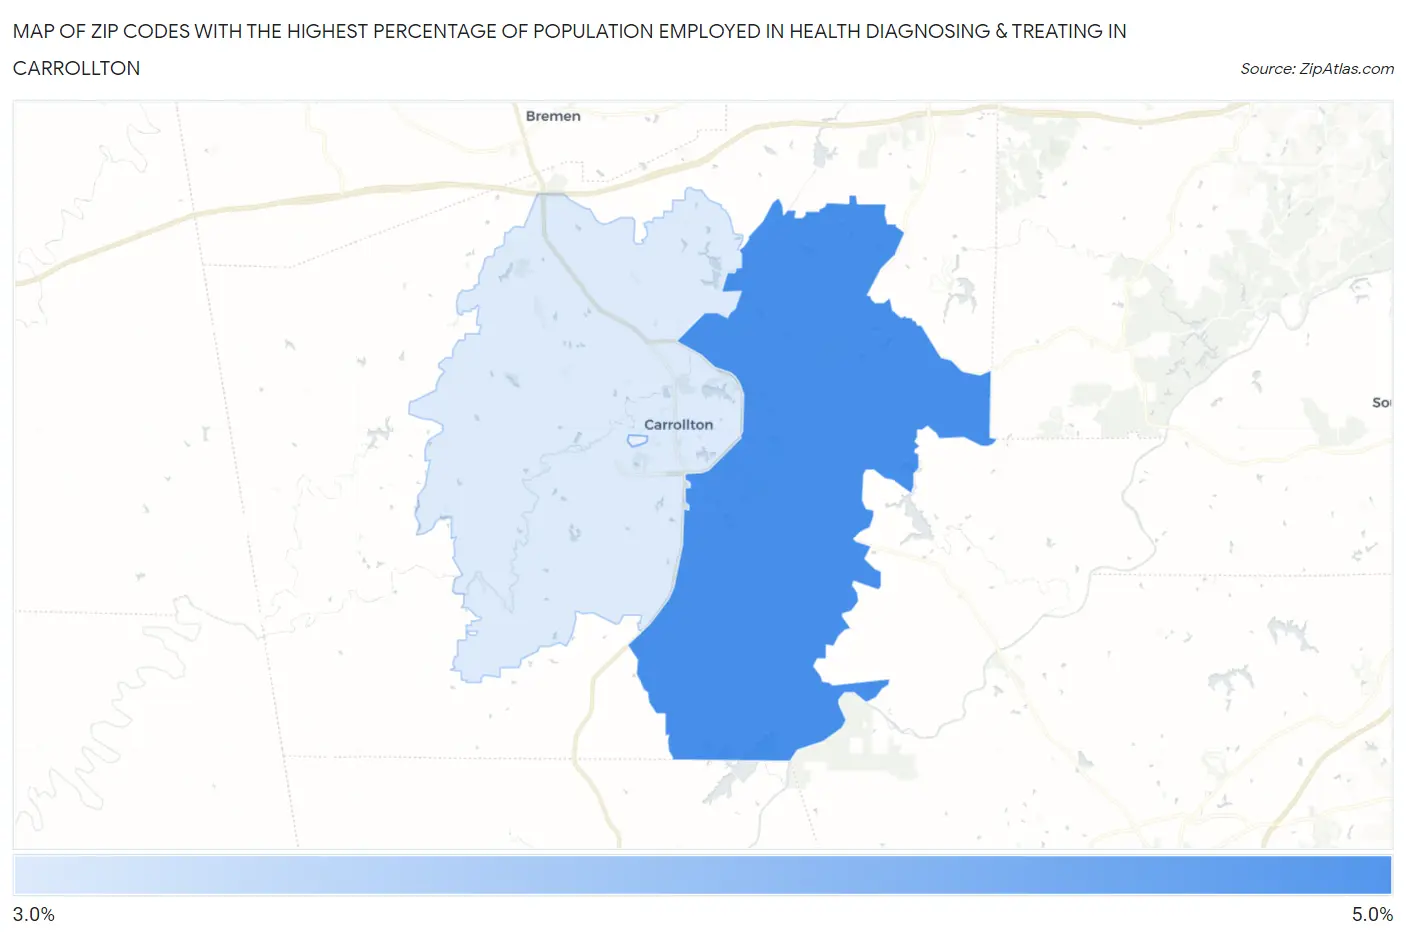
Map of Zip Codes with the Highest Percentage of Population Employed in Health Diagnosing & Treating in Carrollton
3.9%
4.0%
Zip Codes with the Highest Percentage of Population Employed in Health Diagnosing & Treating in Carrollton, GA
| Zip Code | % Employed | vs State | vs National | |
| 1. | 30116 | 4.0% | 5.7%(-1.68)#467 | 6.2%(-2.22)#21,294 |
| 2. | 30117 | 3.9% | 5.7%(-1.83)#484 | 6.2%(-2.37)#21,766 |
1
Common Questions
What are the Top Zip Codes with the Highest Percentage of Population Employed in Health Diagnosing & Treating in Carrollton, GA?
Top Zip Codes with the Highest Percentage of Population Employed in Health Diagnosing & Treating in Carrollton, GA are:
What zip code has the Highest Percentage of Population Employed in Health Diagnosing & Treating in Carrollton, GA?
30116 has the Highest Percentage of Population Employed in Health Diagnosing & Treating in Carrollton, GA with 4.0%.
What is the Percentage of Population Employed in Health Diagnosing & Treating in Carrollton, GA?
Percentage of Population Employed in Health Diagnosing & Treating in Carrollton is 3.2%.
What is the Percentage of Population Employed in Health Diagnosing & Treating in Georgia?
Percentage of Population Employed in Health Diagnosing & Treating in Georgia is 5.7%.
What is the Percentage of Population Employed in Health Diagnosing & Treating in the United States?
Percentage of Population Employed in Health Diagnosing & Treating in the United States is 6.2%.