Zip Codes with the Highest Percentage of Population Employed in Health Diagnosing & Treating in Rome, GA
RELATED REPORTS & OPTIONS
Health Diagnosing & Treating
Rome
Compare Zip Codes
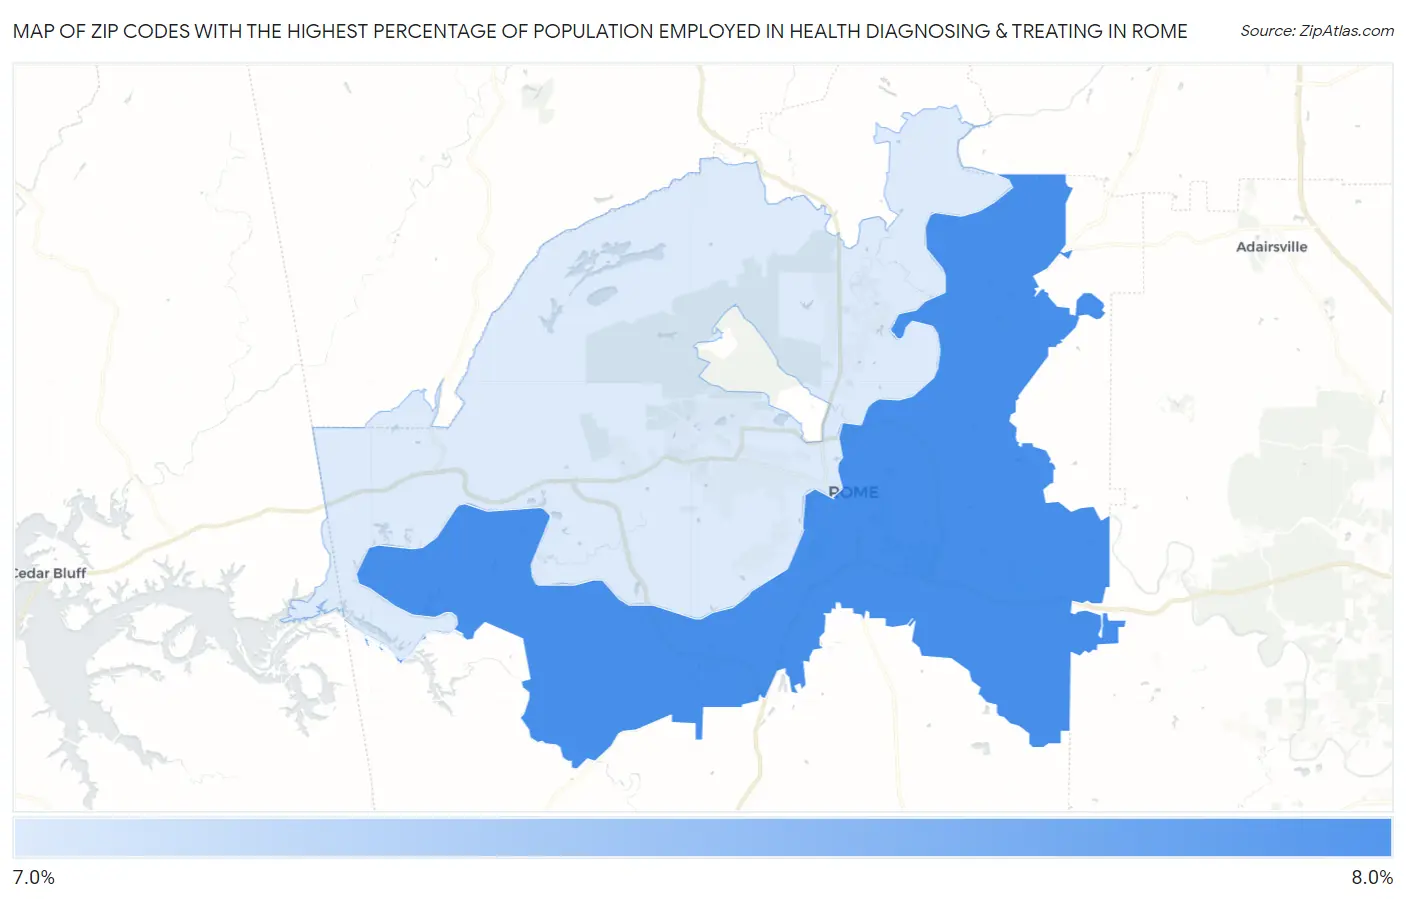
Map of Zip Codes with the Highest Percentage of Population Employed in Health Diagnosing & Treating in Rome
7.2%
7.8%
Zip Codes with the Highest Percentage of Population Employed in Health Diagnosing & Treating in Rome, GA
| Zip Code | % Employed | vs State | vs National | |
| 1. | 30161 | 7.8% | 5.7%(+2.14)#139 | 6.2%(+1.60)#7,892 |
| 2. | 30165 | 7.2% | 5.7%(+1.52)#177 | 6.2%(+0.980)#9,645 |
1
Common Questions
What are the Top Zip Codes with the Highest Percentage of Population Employed in Health Diagnosing & Treating in Rome, GA?
Top Zip Codes with the Highest Percentage of Population Employed in Health Diagnosing & Treating in Rome, GA are:
What zip code has the Highest Percentage of Population Employed in Health Diagnosing & Treating in Rome, GA?
30161 has the Highest Percentage of Population Employed in Health Diagnosing & Treating in Rome, GA with 7.8%.
What is the Percentage of Population Employed in Health Diagnosing & Treating in Rome, GA?
Percentage of Population Employed in Health Diagnosing & Treating in Rome is 7.3%.
What is the Percentage of Population Employed in Health Diagnosing & Treating in Georgia?
Percentage of Population Employed in Health Diagnosing & Treating in Georgia is 5.7%.
What is the Percentage of Population Employed in Health Diagnosing & Treating in the United States?
Percentage of Population Employed in Health Diagnosing & Treating in the United States is 6.2%.