Zip Codes with the Highest Percentage of Population Employed in Health Diagnosing & Treating in Conyers, GA
RELATED REPORTS & OPTIONS
Health Diagnosing & Treating
Conyers
Compare Zip Codes
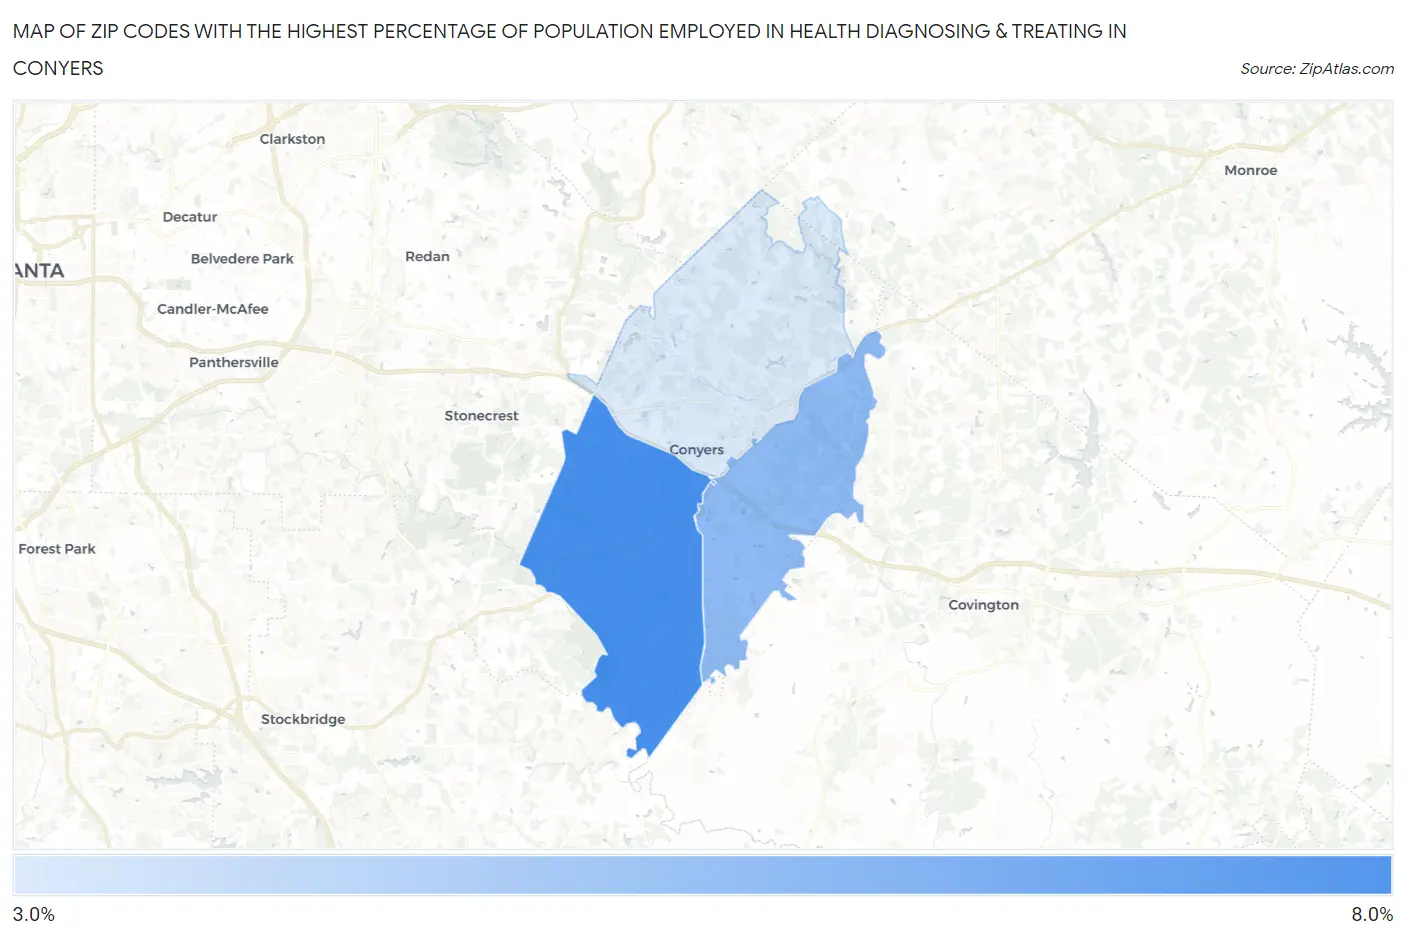
Map of Zip Codes with the Highest Percentage of Population Employed in Health Diagnosing & Treating in Conyers
3.5%
6.8%
Zip Codes with the Highest Percentage of Population Employed in Health Diagnosing & Treating in Conyers, GA
| Zip Code | % Employed | vs State | vs National | |
| 1. | 30094 | 6.8% | 5.7%(+1.11)#208 | 6.2%(+0.573)#10,950 |
| 2. | 30013 | 5.2% | 5.7%(-0.511)#356 | 6.2%(-1.05)#16,955 |
| 3. | 30012 | 3.5% | 5.7%(-2.22)#519 | 6.2%(-2.76)#22,949 |
1
Common Questions
What are the Top Zip Codes with the Highest Percentage of Population Employed in Health Diagnosing & Treating in Conyers, GA?
Top Zip Codes with the Highest Percentage of Population Employed in Health Diagnosing & Treating in Conyers, GA are:
What zip code has the Highest Percentage of Population Employed in Health Diagnosing & Treating in Conyers, GA?
30094 has the Highest Percentage of Population Employed in Health Diagnosing & Treating in Conyers, GA with 6.8%.
What is the Percentage of Population Employed in Health Diagnosing & Treating in Conyers, GA?
Percentage of Population Employed in Health Diagnosing & Treating in Conyers is 3.8%.
What is the Percentage of Population Employed in Health Diagnosing & Treating in Georgia?
Percentage of Population Employed in Health Diagnosing & Treating in Georgia is 5.7%.
What is the Percentage of Population Employed in Health Diagnosing & Treating in the United States?
Percentage of Population Employed in Health Diagnosing & Treating in the United States is 6.2%.