Immigrants from El Salvador vs Immigrants from Northern Africa Married-couple Households
COMPARE
Immigrants from El Salvador
Immigrants from Northern Africa
Married-couple Households
Married-couple Households Comparison
Immigrants from El Salvador
Immigrants from Northern Africa
44.3%
MARRIED-COUPLE HOUSEHOLDS
0.7/ 100
METRIC RATING
245th/ 347
METRIC RANK
46.0%
MARRIED-COUPLE HOUSEHOLDS
24.6/ 100
METRIC RATING
192nd/ 347
METRIC RANK
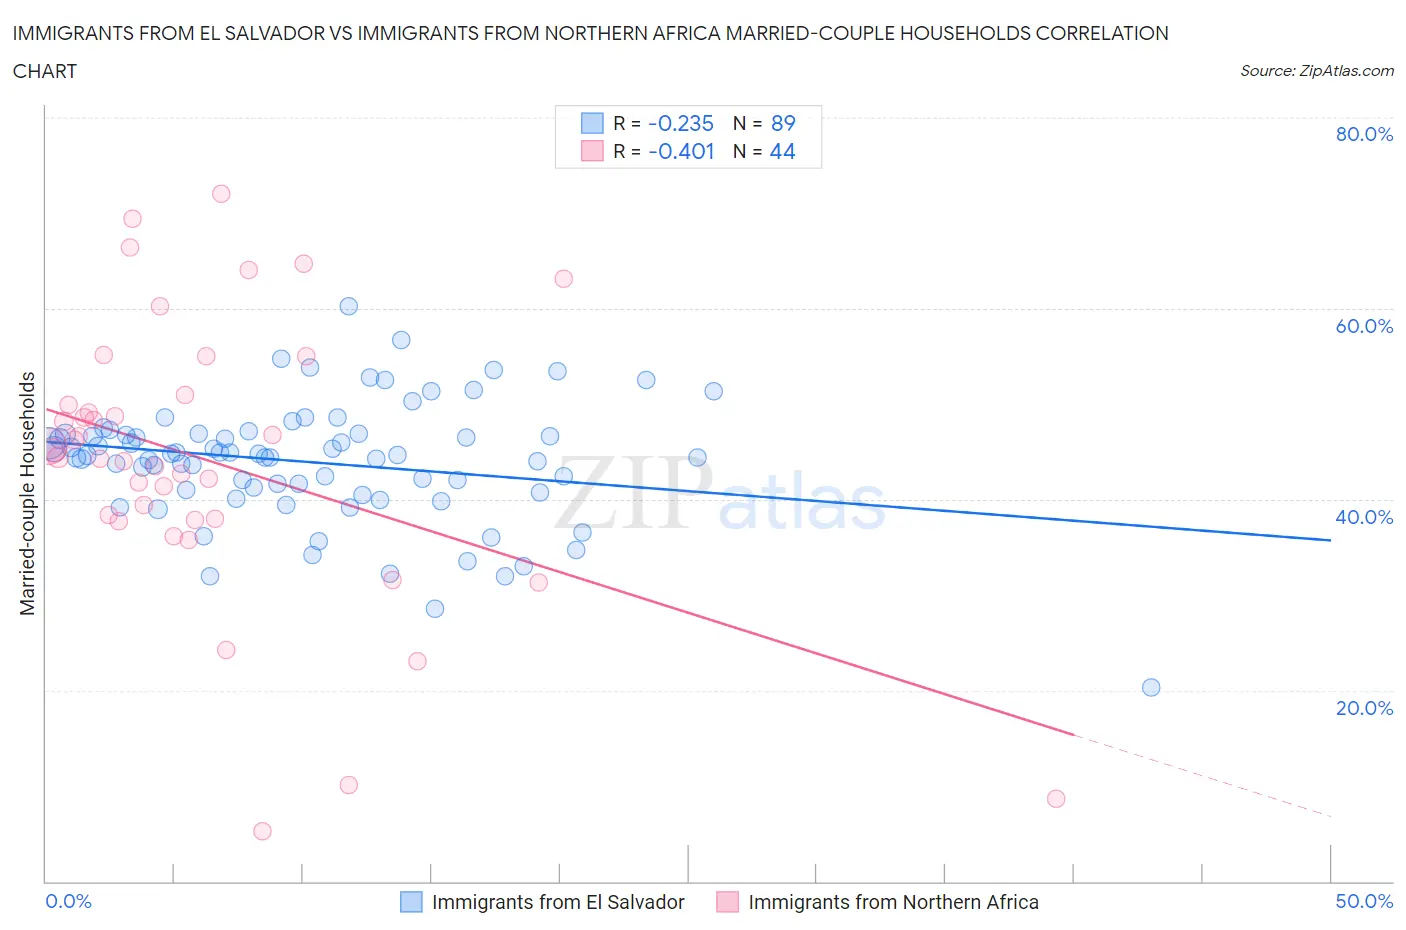
Immigrants from El Salvador vs Immigrants from Northern Africa Married-couple Households Correlation Chart
The statistical analysis conducted on geographies consisting of 357,701,715 people shows a weak negative correlation between the proportion of Immigrants from El Salvador and percentage of married-couple family households in the United States with a correlation coefficient (R) of -0.235 and weighted average of 44.3%. Similarly, the statistical analysis conducted on geographies consisting of 321,083,250 people shows a moderate negative correlation between the proportion of Immigrants from Northern Africa and percentage of married-couple family households in the United States with a correlation coefficient (R) of -0.401 and weighted average of 46.0%, a difference of 3.8%.
Married-couple Households Correlation Summary
| Measurement | Immigrants from El Salvador | Immigrants from Northern Africa |
| Minimum | 20.3% | 5.3% |
| Maximum | 60.3% | 72.0% |
| Range | 40.0% | 66.8% |
| Mean | 43.9% | 44.1% |
| Median | 44.6% | 44.8% |
| Interquartile 25% (IQ1) | 40.9% | 37.9% |
| Interquartile 75% (IQ3) | 46.8% | 50.5% |
| Interquartile Range (IQR) | 6.0% | 12.6% |
| Standard Deviation (Sample) | 6.4% | 14.7% |
| Standard Deviation (Population) | 6.3% | 14.6% |
Similar Demographics by Married-couple Households
Demographics Similar to Immigrants from El Salvador by Married-couple Households
In terms of married-couple households, the demographic groups most similar to Immigrants from El Salvador are Immigrants from Armenia (44.3%, a difference of 0.010%), Immigrants from Cuba (44.2%, a difference of 0.15%), Immigrants from Morocco (44.2%, a difference of 0.15%), Immigrants from Saudi Arabia (44.4%, a difference of 0.29%), and Immigrants from Albania (44.4%, a difference of 0.36%).
| Demographics | Rating | Rank | Married-couple Households |
| Immigrants | Uruguay | 1.1 /100 | #238 | Tragic 44.5% |
| Spanish Americans | 1.1 /100 | #239 | Tragic 44.5% |
| Ute | 1.0 /100 | #240 | Tragic 44.4% |
| Immigrants | Bosnia and Herzegovina | 1.0 /100 | #241 | Tragic 44.4% |
| Immigrants | Albania | 1.0 /100 | #242 | Tragic 44.4% |
| Immigrants | Saudi Arabia | 0.9 /100 | #243 | Tragic 44.4% |
| Immigrants | Armenia | 0.7 /100 | #244 | Tragic 44.3% |
| Immigrants | El Salvador | 0.7 /100 | #245 | Tragic 44.3% |
| Immigrants | Cuba | 0.6 /100 | #246 | Tragic 44.2% |
| Immigrants | Morocco | 0.6 /100 | #247 | Tragic 44.2% |
| Yup'ik | 0.4 /100 | #248 | Tragic 44.1% |
| Immigrants | Kenya | 0.4 /100 | #249 | Tragic 44.1% |
| French American Indians | 0.4 /100 | #250 | Tragic 44.1% |
| German Russians | 0.4 /100 | #251 | Tragic 44.0% |
| Seminole | 0.4 /100 | #252 | Tragic 44.0% |
Demographics Similar to Immigrants from Northern Africa by Married-couple Households
In terms of married-couple households, the demographic groups most similar to Immigrants from Northern Africa are Choctaw (46.0%, a difference of 0.020%), Immigrants from Kuwait (46.0%, a difference of 0.050%), Taiwanese (45.9%, a difference of 0.060%), Mexican American Indian (45.9%, a difference of 0.070%), and Chickasaw (45.9%, a difference of 0.10%).
| Demographics | Rating | Rank | Married-couple Households |
| Brazilians | 35.9 /100 | #185 | Fair 46.2% |
| Albanians | 31.1 /100 | #186 | Fair 46.1% |
| Fijians | 29.2 /100 | #187 | Fair 46.1% |
| South American Indians | 28.4 /100 | #188 | Fair 46.0% |
| Immigrants | Latvia | 26.9 /100 | #189 | Fair 46.0% |
| Immigrants | Kuwait | 25.6 /100 | #190 | Fair 46.0% |
| Choctaw | 24.9 /100 | #191 | Fair 46.0% |
| Immigrants | Northern Africa | 24.6 /100 | #192 | Fair 46.0% |
| Taiwanese | 23.4 /100 | #193 | Fair 45.9% |
| Mexican American Indians | 23.3 /100 | #194 | Fair 45.9% |
| Chickasaw | 22.7 /100 | #195 | Fair 45.9% |
| Immigrants | South America | 22.2 /100 | #196 | Fair 45.9% |
| Cambodians | 21.3 /100 | #197 | Fair 45.9% |
| Ottawa | 19.4 /100 | #198 | Poor 45.8% |
| Carpatho Rusyns | 15.7 /100 | #199 | Poor 45.7% |