Immigrants from El Salvador vs Immigrants from Middle Africa Married-couple Households
COMPARE
Immigrants from El Salvador
Immigrants from Middle Africa
Married-couple Households
Married-couple Households Comparison
Immigrants from El Salvador
Immigrants from Middle Africa
44.3%
MARRIED-COUPLE HOUSEHOLDS
0.7/ 100
METRIC RATING
245th/ 347
METRIC RANK
41.8%
MARRIED-COUPLE HOUSEHOLDS
0.0/ 100
METRIC RATING
298th/ 347
METRIC RANK
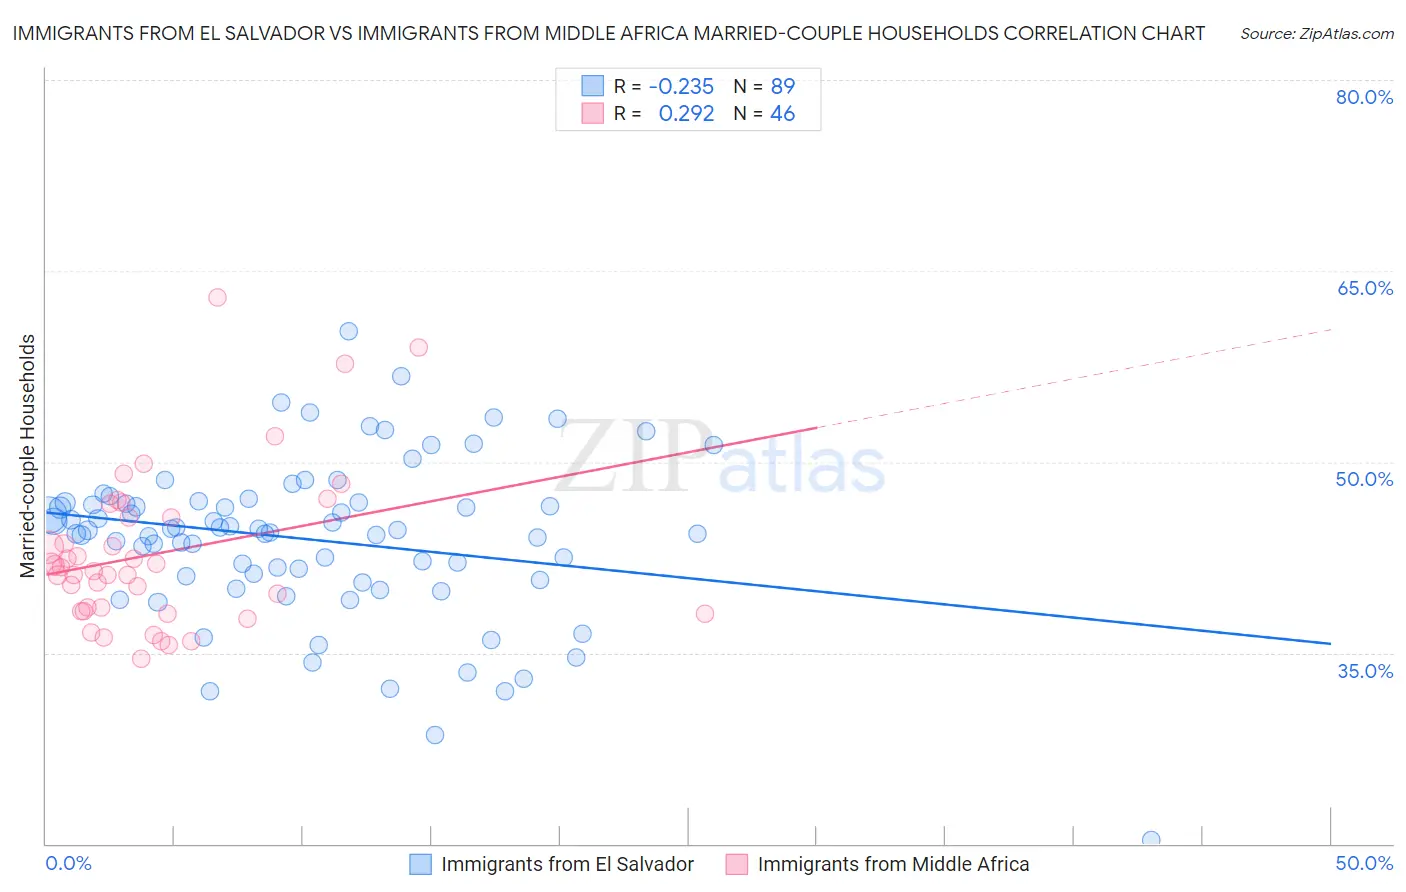
Immigrants from El Salvador vs Immigrants from Middle Africa Married-couple Households Correlation Chart
The statistical analysis conducted on geographies consisting of 357,701,715 people shows a weak negative correlation between the proportion of Immigrants from El Salvador and percentage of married-couple family households in the United States with a correlation coefficient (R) of -0.235 and weighted average of 44.3%. Similarly, the statistical analysis conducted on geographies consisting of 202,654,857 people shows a weak positive correlation between the proportion of Immigrants from Middle Africa and percentage of married-couple family households in the United States with a correlation coefficient (R) of 0.292 and weighted average of 41.8%, a difference of 5.9%.
Married-couple Households Correlation Summary
| Measurement | Immigrants from El Salvador | Immigrants from Middle Africa |
| Minimum | 20.3% | 34.6% |
| Maximum | 60.3% | 62.9% |
| Range | 40.0% | 28.4% |
| Mean | 43.9% | 42.8% |
| Median | 44.6% | 41.6% |
| Interquartile 25% (IQ1) | 40.9% | 38.3% |
| Interquartile 75% (IQ3) | 46.8% | 45.6% |
| Interquartile Range (IQR) | 6.0% | 7.4% |
| Standard Deviation (Sample) | 6.4% | 6.2% |
| Standard Deviation (Population) | 6.3% | 6.1% |
Similar Demographics by Married-couple Households
Demographics Similar to Immigrants from El Salvador by Married-couple Households
In terms of married-couple households, the demographic groups most similar to Immigrants from El Salvador are Immigrants from Armenia (44.3%, a difference of 0.010%), Immigrants from Cuba (44.2%, a difference of 0.15%), Immigrants from Morocco (44.2%, a difference of 0.15%), Immigrants from Saudi Arabia (44.4%, a difference of 0.29%), and Immigrants from Albania (44.4%, a difference of 0.36%).
| Demographics | Rating | Rank | Married-couple Households |
| Immigrants | Uruguay | 1.1 /100 | #238 | Tragic 44.5% |
| Spanish Americans | 1.1 /100 | #239 | Tragic 44.5% |
| Ute | 1.0 /100 | #240 | Tragic 44.4% |
| Immigrants | Bosnia and Herzegovina | 1.0 /100 | #241 | Tragic 44.4% |
| Immigrants | Albania | 1.0 /100 | #242 | Tragic 44.4% |
| Immigrants | Saudi Arabia | 0.9 /100 | #243 | Tragic 44.4% |
| Immigrants | Armenia | 0.7 /100 | #244 | Tragic 44.3% |
| Immigrants | El Salvador | 0.7 /100 | #245 | Tragic 44.3% |
| Immigrants | Cuba | 0.6 /100 | #246 | Tragic 44.2% |
| Immigrants | Morocco | 0.6 /100 | #247 | Tragic 44.2% |
| Yup'ik | 0.4 /100 | #248 | Tragic 44.1% |
| Immigrants | Kenya | 0.4 /100 | #249 | Tragic 44.1% |
| French American Indians | 0.4 /100 | #250 | Tragic 44.1% |
| German Russians | 0.4 /100 | #251 | Tragic 44.0% |
| Seminole | 0.4 /100 | #252 | Tragic 44.0% |
Demographics Similar to Immigrants from Middle Africa by Married-couple Households
In terms of married-couple households, the demographic groups most similar to Immigrants from Middle Africa are Arapaho (41.8%, a difference of 0.040%), Immigrants from Ghana (41.8%, a difference of 0.080%), Immigrants from Belize (41.8%, a difference of 0.090%), Immigrants from Bahamas (41.7%, a difference of 0.30%), and Immigrants from Sudan (41.9%, a difference of 0.33%).
| Demographics | Rating | Rank | Married-couple Households |
| Paiute | 0.0 /100 | #291 | Tragic 42.1% |
| Indonesians | 0.0 /100 | #292 | Tragic 42.0% |
| Menominee | 0.0 /100 | #293 | Tragic 42.0% |
| Immigrants | Yemen | 0.0 /100 | #294 | Tragic 42.0% |
| Kiowa | 0.0 /100 | #295 | Tragic 42.0% |
| Immigrants | Sudan | 0.0 /100 | #296 | Tragic 41.9% |
| Arapaho | 0.0 /100 | #297 | Tragic 41.8% |
| Immigrants | Middle Africa | 0.0 /100 | #298 | Tragic 41.8% |
| Immigrants | Ghana | 0.0 /100 | #299 | Tragic 41.8% |
| Immigrants | Belize | 0.0 /100 | #300 | Tragic 41.8% |
| Immigrants | Bahamas | 0.0 /100 | #301 | Tragic 41.7% |
| Immigrants | Honduras | 0.0 /100 | #302 | Tragic 41.6% |
| Sub-Saharan Africans | 0.0 /100 | #303 | Tragic 41.6% |
| Immigrants | Guyana | 0.0 /100 | #304 | Tragic 41.6% |
| Sioux | 0.0 /100 | #305 | Tragic 41.5% |