Creek vs Immigrants from Northern Africa Married-couple Households
COMPARE
Creek
Immigrants from Northern Africa
Married-couple Households
Married-couple Households Comparison
Creek
Immigrants from Northern Africa
45.3%
MARRIED-COUPLE HOUSEHOLDS
6.4/ 100
METRIC RATING
212th/ 347
METRIC RANK
46.0%
MARRIED-COUPLE HOUSEHOLDS
24.6/ 100
METRIC RATING
192nd/ 347
METRIC RANK
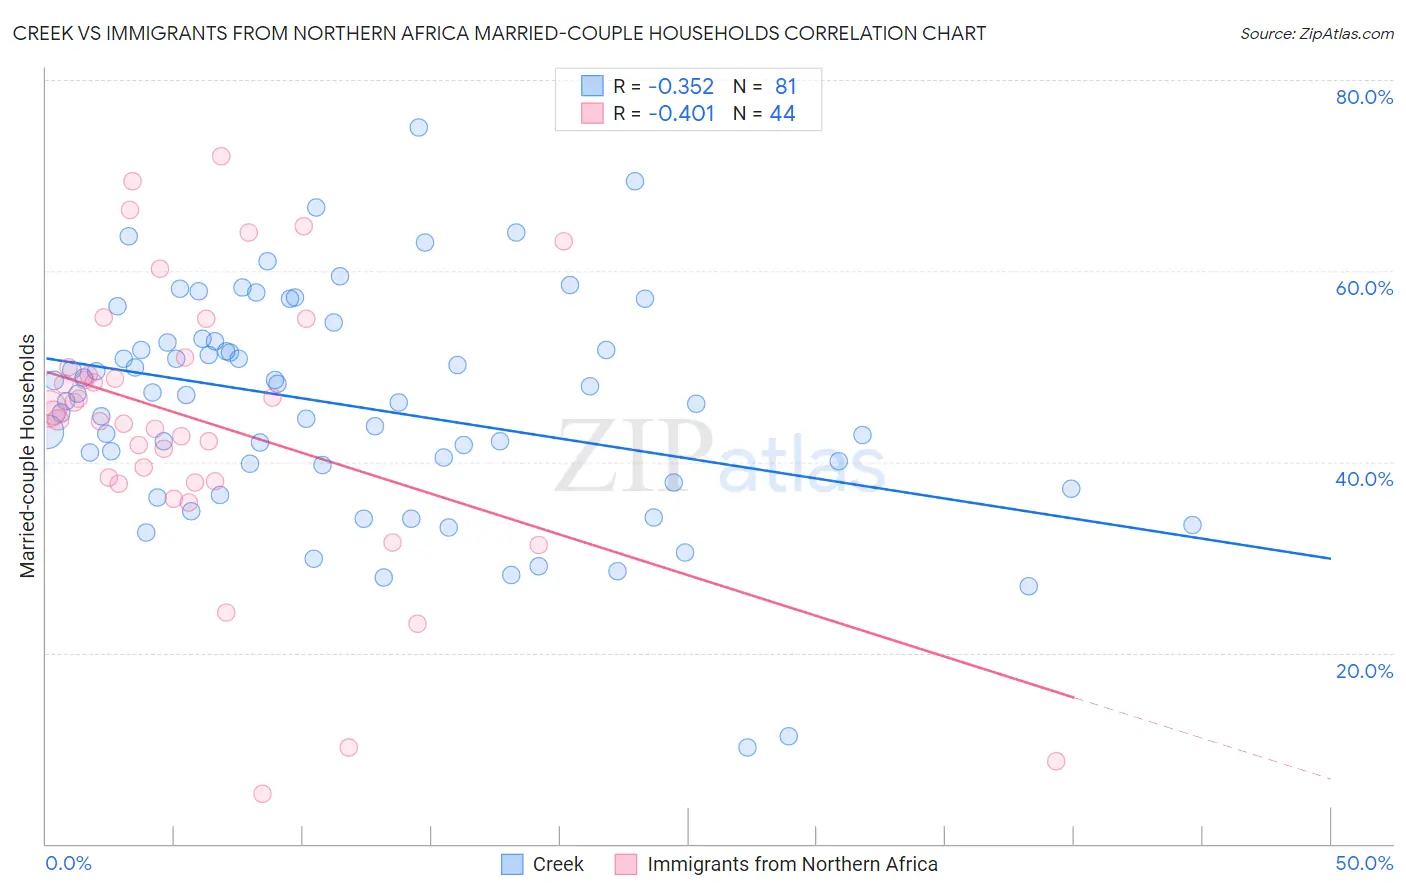
Creek vs Immigrants from Northern Africa Married-couple Households Correlation Chart
The statistical analysis conducted on geographies consisting of 178,433,601 people shows a mild negative correlation between the proportion of Creek and percentage of married-couple family households in the United States with a correlation coefficient (R) of -0.352 and weighted average of 45.3%. Similarly, the statistical analysis conducted on geographies consisting of 321,083,250 people shows a moderate negative correlation between the proportion of Immigrants from Northern Africa and percentage of married-couple family households in the United States with a correlation coefficient (R) of -0.401 and weighted average of 46.0%, a difference of 1.5%.
Married-couple Households Correlation Summary
| Measurement | Creek | Immigrants from Northern Africa |
| Minimum | 10.1% | 5.3% |
| Maximum | 75.0% | 72.0% |
| Range | 64.9% | 66.8% |
| Mean | 45.8% | 44.1% |
| Median | 47.0% | 44.8% |
| Interquartile 25% (IQ1) | 38.8% | 37.9% |
| Interquartile 75% (IQ3) | 52.6% | 50.5% |
| Interquartile Range (IQR) | 13.9% | 12.6% |
| Standard Deviation (Sample) | 11.8% | 14.7% |
| Standard Deviation (Population) | 11.7% | 14.6% |
Demographics Similar to Creek and Immigrants from Northern Africa by Married-couple Households
In terms of married-couple households, the demographic groups most similar to Creek are Immigrants from Spain (45.3%, a difference of 0.13%), Cuban (45.4%, a difference of 0.18%), Immigrants from Uzbekistan (45.4%, a difference of 0.27%), Hispanic or Latino (45.4%, a difference of 0.31%), and Immigrants from France (45.4%, a difference of 0.32%). Similarly, the demographic groups most similar to Immigrants from Northern Africa are Taiwanese (45.9%, a difference of 0.060%), Mexican American Indian (45.9%, a difference of 0.070%), Chickasaw (45.9%, a difference of 0.10%), Immigrants from South America (45.9%, a difference of 0.13%), and Cambodian (45.9%, a difference of 0.18%).
| Demographics | Rating | Rank | Married-couple Households |
| Immigrants | Northern Africa | 24.6 /100 | #192 | Fair 46.0% |
| Taiwanese | 23.4 /100 | #193 | Fair 45.9% |
| Mexican American Indians | 23.3 /100 | #194 | Fair 45.9% |
| Chickasaw | 22.7 /100 | #195 | Fair 45.9% |
| Immigrants | South America | 22.2 /100 | #196 | Fair 45.9% |
| Cambodians | 21.3 /100 | #197 | Fair 45.9% |
| Ottawa | 19.4 /100 | #198 | Poor 45.8% |
| Carpatho Rusyns | 15.7 /100 | #199 | Poor 45.7% |
| Potawatomi | 15.6 /100 | #200 | Poor 45.7% |
| Immigrants | Serbia | 15.2 /100 | #201 | Poor 45.7% |
| Immigrants | Central America | 14.2 /100 | #202 | Poor 45.7% |
| Alaska Natives | 13.0 /100 | #203 | Poor 45.6% |
| Aleuts | 12.5 /100 | #204 | Poor 45.6% |
| Nepalese | 11.9 /100 | #205 | Poor 45.6% |
| Uruguayans | 10.4 /100 | #206 | Poor 45.5% |
| Immigrants | France | 8.8 /100 | #207 | Tragic 45.4% |
| Hispanics or Latinos | 8.7 /100 | #208 | Tragic 45.4% |
| Immigrants | Uzbekistan | 8.4 /100 | #209 | Tragic 45.4% |
| Cubans | 7.7 /100 | #210 | Tragic 45.4% |
| Immigrants | Spain | 7.3 /100 | #211 | Tragic 45.3% |
| Creek | 6.4 /100 | #212 | Tragic 45.3% |