Immigrants from El Salvador vs Somali Married-couple Households
COMPARE
Immigrants from El Salvador
Somali
Married-couple Households
Married-couple Households Comparison
Immigrants from El Salvador
Somalis
44.3%
MARRIED-COUPLE HOUSEHOLDS
0.7/ 100
METRIC RATING
245th/ 347
METRIC RANK
39.0%
MARRIED-COUPLE HOUSEHOLDS
0.0/ 100
METRIC RATING
332nd/ 347
METRIC RANK
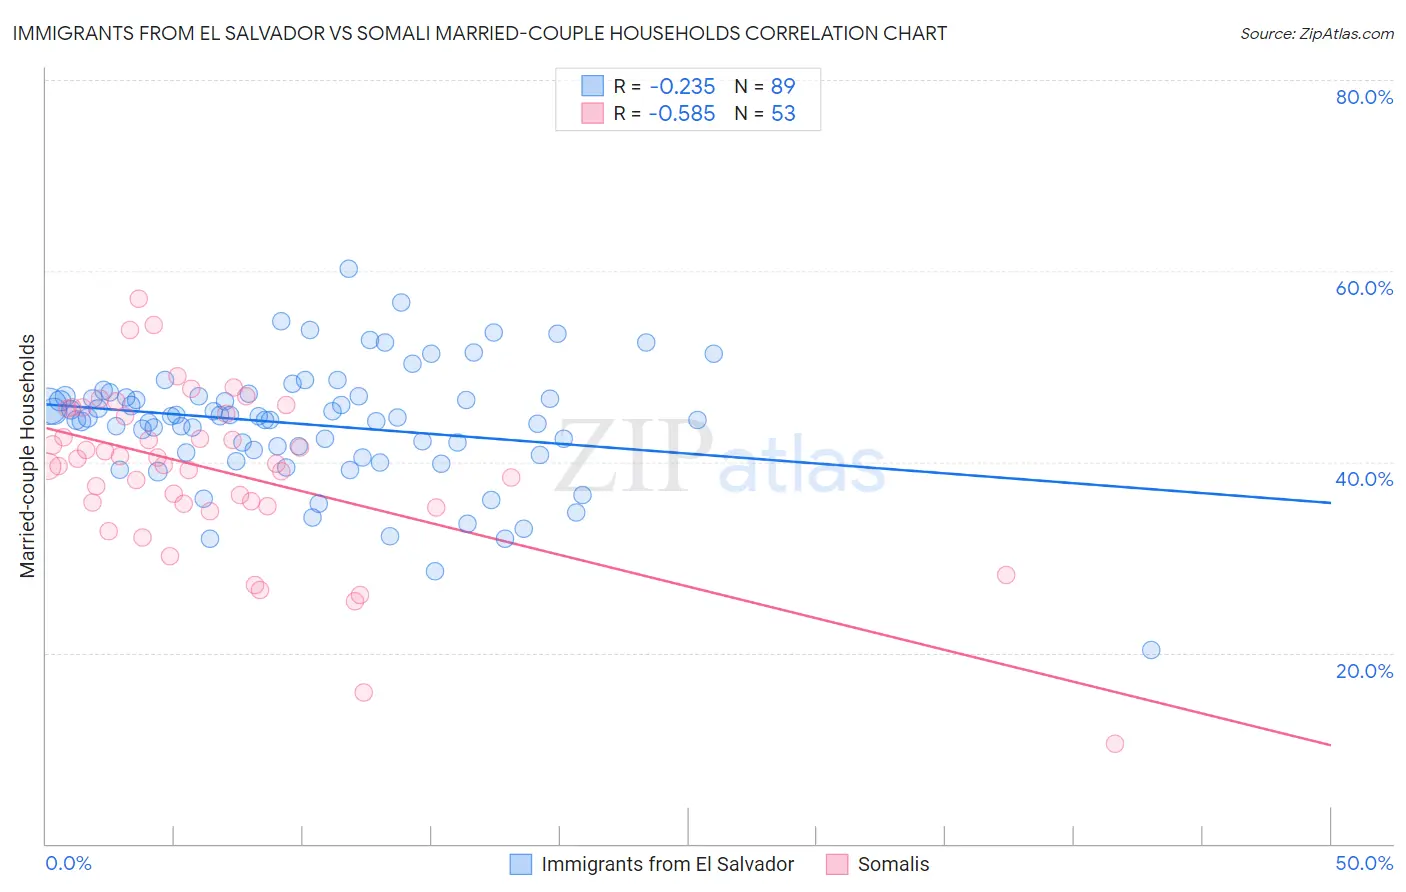
Immigrants from El Salvador vs Somali Married-couple Households Correlation Chart
The statistical analysis conducted on geographies consisting of 357,701,715 people shows a weak negative correlation between the proportion of Immigrants from El Salvador and percentage of married-couple family households in the United States with a correlation coefficient (R) of -0.235 and weighted average of 44.3%. Similarly, the statistical analysis conducted on geographies consisting of 99,290,778 people shows a substantial negative correlation between the proportion of Somalis and percentage of married-couple family households in the United States with a correlation coefficient (R) of -0.585 and weighted average of 39.0%, a difference of 13.5%.
Married-couple Households Correlation Summary
| Measurement | Immigrants from El Salvador | Somali |
| Minimum | 20.3% | 10.5% |
| Maximum | 60.3% | 57.0% |
| Range | 40.0% | 46.6% |
| Mean | 43.9% | 39.1% |
| Median | 44.6% | 39.8% |
| Interquartile 25% (IQ1) | 40.9% | 35.5% |
| Interquartile 75% (IQ3) | 46.8% | 45.3% |
| Interquartile Range (IQR) | 6.0% | 9.8% |
| Standard Deviation (Sample) | 6.4% | 8.7% |
| Standard Deviation (Population) | 6.3% | 8.6% |
Similar Demographics by Married-couple Households
Demographics Similar to Immigrants from El Salvador by Married-couple Households
In terms of married-couple households, the demographic groups most similar to Immigrants from El Salvador are Immigrants from Armenia (44.3%, a difference of 0.010%), Immigrants from Cuba (44.2%, a difference of 0.15%), Immigrants from Morocco (44.2%, a difference of 0.15%), Immigrants from Saudi Arabia (44.4%, a difference of 0.29%), and Immigrants from Albania (44.4%, a difference of 0.36%).
| Demographics | Rating | Rank | Married-couple Households |
| Immigrants | Uruguay | 1.1 /100 | #238 | Tragic 44.5% |
| Spanish Americans | 1.1 /100 | #239 | Tragic 44.5% |
| Ute | 1.0 /100 | #240 | Tragic 44.4% |
| Immigrants | Bosnia and Herzegovina | 1.0 /100 | #241 | Tragic 44.4% |
| Immigrants | Albania | 1.0 /100 | #242 | Tragic 44.4% |
| Immigrants | Saudi Arabia | 0.9 /100 | #243 | Tragic 44.4% |
| Immigrants | Armenia | 0.7 /100 | #244 | Tragic 44.3% |
| Immigrants | El Salvador | 0.7 /100 | #245 | Tragic 44.3% |
| Immigrants | Cuba | 0.6 /100 | #246 | Tragic 44.2% |
| Immigrants | Morocco | 0.6 /100 | #247 | Tragic 44.2% |
| Yup'ik | 0.4 /100 | #248 | Tragic 44.1% |
| Immigrants | Kenya | 0.4 /100 | #249 | Tragic 44.1% |
| French American Indians | 0.4 /100 | #250 | Tragic 44.1% |
| German Russians | 0.4 /100 | #251 | Tragic 44.0% |
| Seminole | 0.4 /100 | #252 | Tragic 44.0% |
Demographics Similar to Somalis by Married-couple Households
In terms of married-couple households, the demographic groups most similar to Somalis are Immigrants from West Indies (39.0%, a difference of 0.030%), Immigrants from Congo (39.0%, a difference of 0.090%), Immigrants from Barbados (39.2%, a difference of 0.52%), Immigrants from St. Vincent and the Grenadines (38.7%, a difference of 0.81%), and Immigrants from Dominica (39.4%, a difference of 0.96%).
| Demographics | Rating | Rank | Married-couple Households |
| Pueblo | 0.0 /100 | #325 | Tragic 40.0% |
| U.S. Virgin Islanders | 0.0 /100 | #326 | Tragic 39.8% |
| Lumbee | 0.0 /100 | #327 | Tragic 39.6% |
| Barbadians | 0.0 /100 | #328 | Tragic 39.4% |
| Immigrants | Dominica | 0.0 /100 | #329 | Tragic 39.4% |
| Immigrants | Barbados | 0.0 /100 | #330 | Tragic 39.2% |
| Immigrants | Congo | 0.0 /100 | #331 | Tragic 39.0% |
| Somalis | 0.0 /100 | #332 | Tragic 39.0% |
| Immigrants | West Indies | 0.0 /100 | #333 | Tragic 39.0% |
| Immigrants | St. Vincent and the Grenadines | 0.0 /100 | #334 | Tragic 38.7% |
| Senegalese | 0.0 /100 | #335 | Tragic 38.6% |
| Blacks/African Americans | 0.0 /100 | #336 | Tragic 38.5% |
| Immigrants | Somalia | 0.0 /100 | #337 | Tragic 38.4% |
| Immigrants | Senegal | 0.0 /100 | #338 | Tragic 38.4% |
| British West Indians | 0.0 /100 | #339 | Tragic 38.3% |