Fijian vs Indian (Asian) Married-couple Households
COMPARE
Fijian
Indian (Asian)
Married-couple Households
Married-couple Households Comparison
Fijians
Indians (Asian)
46.1%
MARRIED-COUPLE HOUSEHOLDS
29.2/ 100
METRIC RATING
187th/ 347
METRIC RANK
48.7%
MARRIED-COUPLE HOUSEHOLDS
99.4/ 100
METRIC RATING
48th/ 347
METRIC RANK
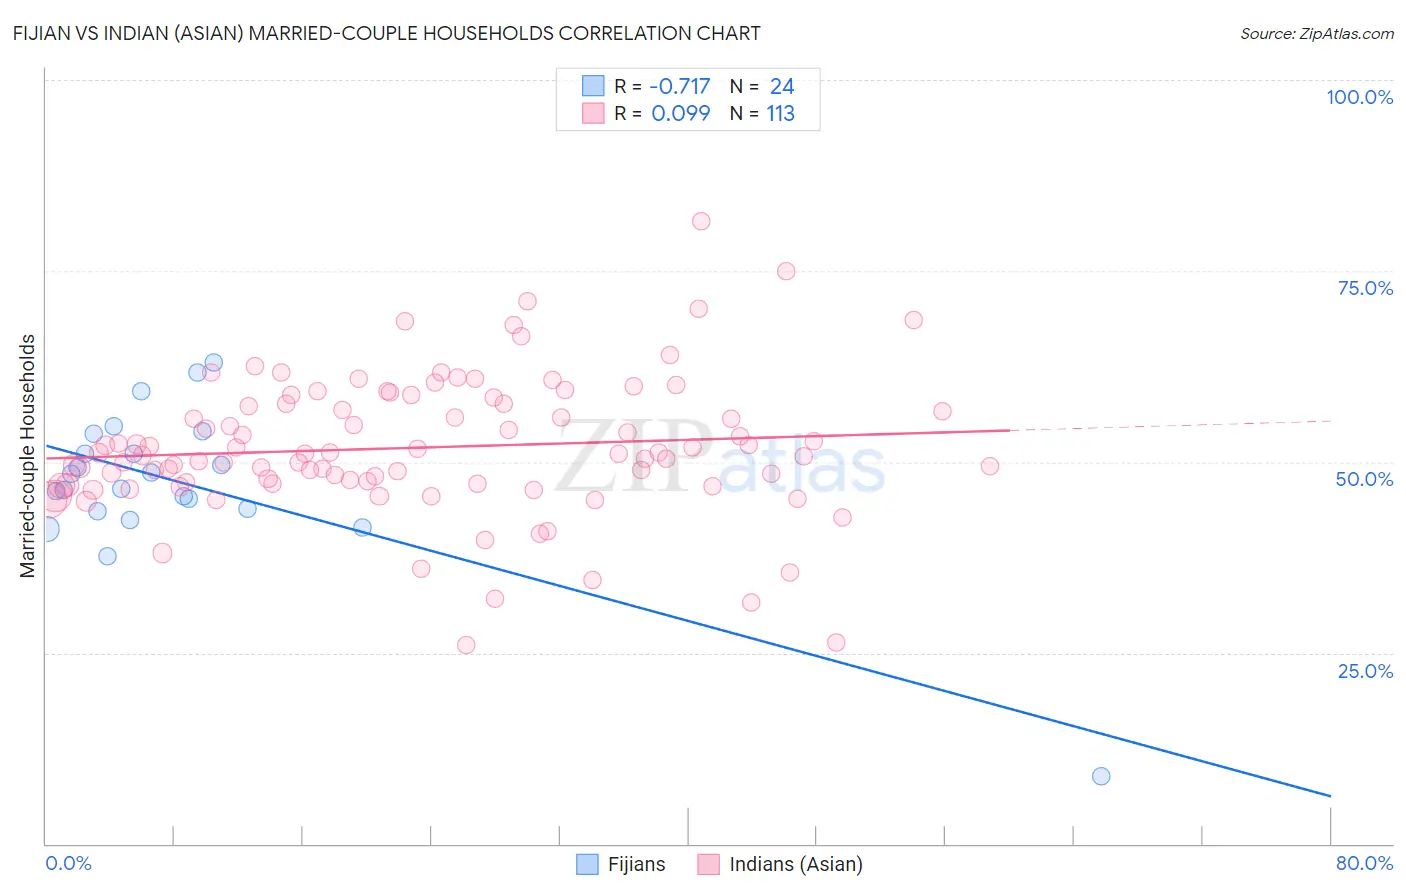
Fijian vs Indian (Asian) Married-couple Households Correlation Chart
The statistical analysis conducted on geographies consisting of 55,947,966 people shows a strong negative correlation between the proportion of Fijians and percentage of married-couple family households in the United States with a correlation coefficient (R) of -0.717 and weighted average of 46.1%. Similarly, the statistical analysis conducted on geographies consisting of 494,754,357 people shows a slight positive correlation between the proportion of Indians (Asian) and percentage of married-couple family households in the United States with a correlation coefficient (R) of 0.099 and weighted average of 48.7%, a difference of 5.8%.
Married-couple Households Correlation Summary
| Measurement | Fijian | Indian (Asian) |
| Minimum | 8.8% | 26.0% |
| Maximum | 63.0% | 81.5% |
| Range | 54.2% | 55.5% |
| Mean | 47.2% | 51.9% |
| Median | 47.5% | 51.0% |
| Interquartile 25% (IQ1) | 43.7% | 47.1% |
| Interquartile 75% (IQ3) | 52.4% | 57.6% |
| Interquartile Range (IQR) | 8.7% | 10.5% |
| Standard Deviation (Sample) | 10.4% | 9.1% |
| Standard Deviation (Population) | 10.2% | 9.0% |
Similar Demographics by Married-couple Households
Demographics Similar to Fijians by Married-couple Households
In terms of married-couple households, the demographic groups most similar to Fijians are South American Indian (46.0%, a difference of 0.040%), Albanian (46.1%, a difference of 0.080%), Immigrants from Latvia (46.0%, a difference of 0.11%), Immigrants from Kuwait (46.0%, a difference of 0.18%), and Choctaw (46.0%, a difference of 0.21%).
| Demographics | Rating | Rank | Married-couple Households |
| Mongolians | 42.0 /100 | #180 | Average 46.3% |
| Malaysians | 41.8 /100 | #181 | Average 46.3% |
| Yugoslavians | 38.9 /100 | #182 | Fair 46.2% |
| Immigrants | Brazil | 38.3 /100 | #183 | Fair 46.2% |
| Immigrants | Switzerland | 36.9 /100 | #184 | Fair 46.2% |
| Brazilians | 35.9 /100 | #185 | Fair 46.2% |
| Albanians | 31.1 /100 | #186 | Fair 46.1% |
| Fijians | 29.2 /100 | #187 | Fair 46.1% |
| South American Indians | 28.4 /100 | #188 | Fair 46.0% |
| Immigrants | Latvia | 26.9 /100 | #189 | Fair 46.0% |
| Immigrants | Kuwait | 25.6 /100 | #190 | Fair 46.0% |
| Choctaw | 24.9 /100 | #191 | Fair 46.0% |
| Immigrants | Northern Africa | 24.6 /100 | #192 | Fair 46.0% |
| Taiwanese | 23.4 /100 | #193 | Fair 45.9% |
| Mexican American Indians | 23.3 /100 | #194 | Fair 45.9% |
Demographics Similar to Indians (Asian) by Married-couple Households
In terms of married-couple households, the demographic groups most similar to Indians (Asian) are British (48.7%, a difference of 0.050%), Immigrants from Sri Lanka (48.7%, a difference of 0.060%), Tsimshian (48.7%, a difference of 0.070%), Samoan (48.7%, a difference of 0.10%), and Immigrants from Eastern Asia (48.8%, a difference of 0.12%).
| Demographics | Rating | Rank | Married-couple Households |
| Immigrants | Lebanon | 99.6 /100 | #41 | Exceptional 48.9% |
| Immigrants | Vietnam | 99.6 /100 | #42 | Exceptional 48.8% |
| Immigrants | Iran | 99.6 /100 | #43 | Exceptional 48.8% |
| Welsh | 99.5 /100 | #44 | Exceptional 48.8% |
| Immigrants | Eastern Asia | 99.5 /100 | #45 | Exceptional 48.8% |
| Tsimshian | 99.5 /100 | #46 | Exceptional 48.7% |
| British | 99.5 /100 | #47 | Exceptional 48.7% |
| Indians (Asian) | 99.4 /100 | #48 | Exceptional 48.7% |
| Immigrants | Sri Lanka | 99.4 /100 | #49 | Exceptional 48.7% |
| Samoans | 99.4 /100 | #50 | Exceptional 48.7% |
| Eastern Europeans | 99.3 /100 | #51 | Exceptional 48.6% |
| Irish | 99.3 /100 | #52 | Exceptional 48.6% |
| Whites/Caucasians | 99.3 /100 | #53 | Exceptional 48.6% |
| Immigrants | Lithuania | 99.3 /100 | #54 | Exceptional 48.6% |
| Austrians | 99.3 /100 | #55 | Exceptional 48.6% |