Luxembourger vs Indian (Asian) Married-couple Households
COMPARE
Luxembourger
Indian (Asian)
Married-couple Households
Married-couple Households Comparison
Luxembourgers
Indians (Asian)
48.5%
MARRIED-COUPLE HOUSEHOLDS
99.1/ 100
METRIC RATING
62nd/ 347
METRIC RANK
48.7%
MARRIED-COUPLE HOUSEHOLDS
99.4/ 100
METRIC RATING
48th/ 347
METRIC RANK
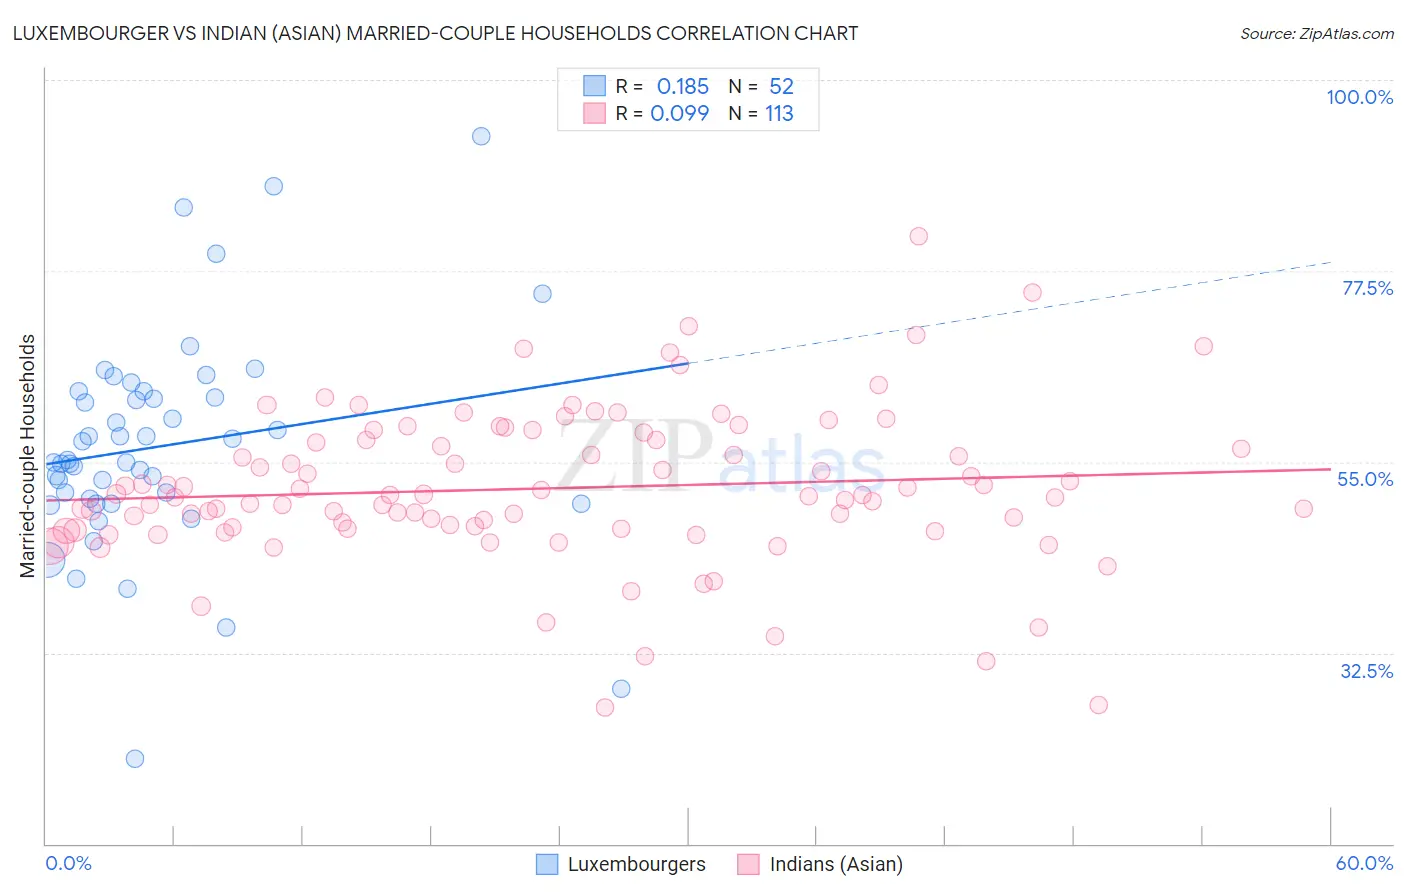
Luxembourger vs Indian (Asian) Married-couple Households Correlation Chart
The statistical analysis conducted on geographies consisting of 144,648,044 people shows a poor positive correlation between the proportion of Luxembourgers and percentage of married-couple family households in the United States with a correlation coefficient (R) of 0.185 and weighted average of 48.5%. Similarly, the statistical analysis conducted on geographies consisting of 494,754,357 people shows a slight positive correlation between the proportion of Indians (Asian) and percentage of married-couple family households in the United States with a correlation coefficient (R) of 0.099 and weighted average of 48.7%, a difference of 0.47%.
Married-couple Households Correlation Summary
| Measurement | Luxembourger | Indian (Asian) |
| Minimum | 20.0% | 26.0% |
| Maximum | 93.3% | 81.5% |
| Range | 73.3% | 55.5% |
| Mean | 56.9% | 51.9% |
| Median | 55.1% | 51.0% |
| Interquartile 25% (IQ1) | 50.3% | 47.1% |
| Interquartile 75% (IQ3) | 62.9% | 57.6% |
| Interquartile Range (IQR) | 12.6% | 10.5% |
| Standard Deviation (Sample) | 13.0% | 9.1% |
| Standard Deviation (Population) | 12.9% | 9.0% |
Demographics Similar to Luxembourgers and Indians (Asian) by Married-couple Households
In terms of married-couple households, the demographic groups most similar to Luxembourgers are Bulgarian (48.5%, a difference of 0.0%), Croatian (48.5%, a difference of 0.060%), Basque (48.4%, a difference of 0.060%), Northern European (48.4%, a difference of 0.080%), and Immigrants from Canada (48.4%, a difference of 0.090%). Similarly, the demographic groups most similar to Indians (Asian) are British (48.7%, a difference of 0.050%), Immigrants from Sri Lanka (48.7%, a difference of 0.060%), Tsimshian (48.7%, a difference of 0.070%), Samoan (48.7%, a difference of 0.10%), and Immigrants from Eastern Asia (48.8%, a difference of 0.12%).
| Demographics | Rating | Rank | Married-couple Households |
| Immigrants | Eastern Asia | 99.5 /100 | #45 | Exceptional 48.8% |
| Tsimshian | 99.5 /100 | #46 | Exceptional 48.7% |
| British | 99.5 /100 | #47 | Exceptional 48.7% |
| Indians (Asian) | 99.4 /100 | #48 | Exceptional 48.7% |
| Immigrants | Sri Lanka | 99.4 /100 | #49 | Exceptional 48.7% |
| Samoans | 99.4 /100 | #50 | Exceptional 48.7% |
| Eastern Europeans | 99.3 /100 | #51 | Exceptional 48.6% |
| Irish | 99.3 /100 | #52 | Exceptional 48.6% |
| Whites/Caucasians | 99.3 /100 | #53 | Exceptional 48.6% |
| Immigrants | Lithuania | 99.3 /100 | #54 | Exceptional 48.6% |
| Austrians | 99.3 /100 | #55 | Exceptional 48.6% |
| Immigrants | Northern Europe | 99.3 /100 | #56 | Exceptional 48.6% |
| Poles | 99.2 /100 | #57 | Exceptional 48.5% |
| Immigrants | Indonesia | 99.2 /100 | #58 | Exceptional 48.5% |
| Czechoslovakians | 99.2 /100 | #59 | Exceptional 48.5% |
| Croatians | 99.1 /100 | #60 | Exceptional 48.5% |
| Bulgarians | 99.1 /100 | #61 | Exceptional 48.5% |
| Luxembourgers | 99.1 /100 | #62 | Exceptional 48.5% |
| Basques | 99.0 /100 | #63 | Exceptional 48.4% |
| Northern Europeans | 99.0 /100 | #64 | Exceptional 48.4% |
| Immigrants | Canada | 99.0 /100 | #65 | Exceptional 48.4% |