Fijian vs Bahamian Married-couple Households
COMPARE
Fijian
Bahamian
Married-couple Households
Married-couple Households Comparison
Fijians
Bahamians
46.1%
MARRIED-COUPLE HOUSEHOLDS
29.2/ 100
METRIC RATING
187th/ 347
METRIC RANK
40.5%
MARRIED-COUPLE HOUSEHOLDS
0.0/ 100
METRIC RATING
319th/ 347
METRIC RANK
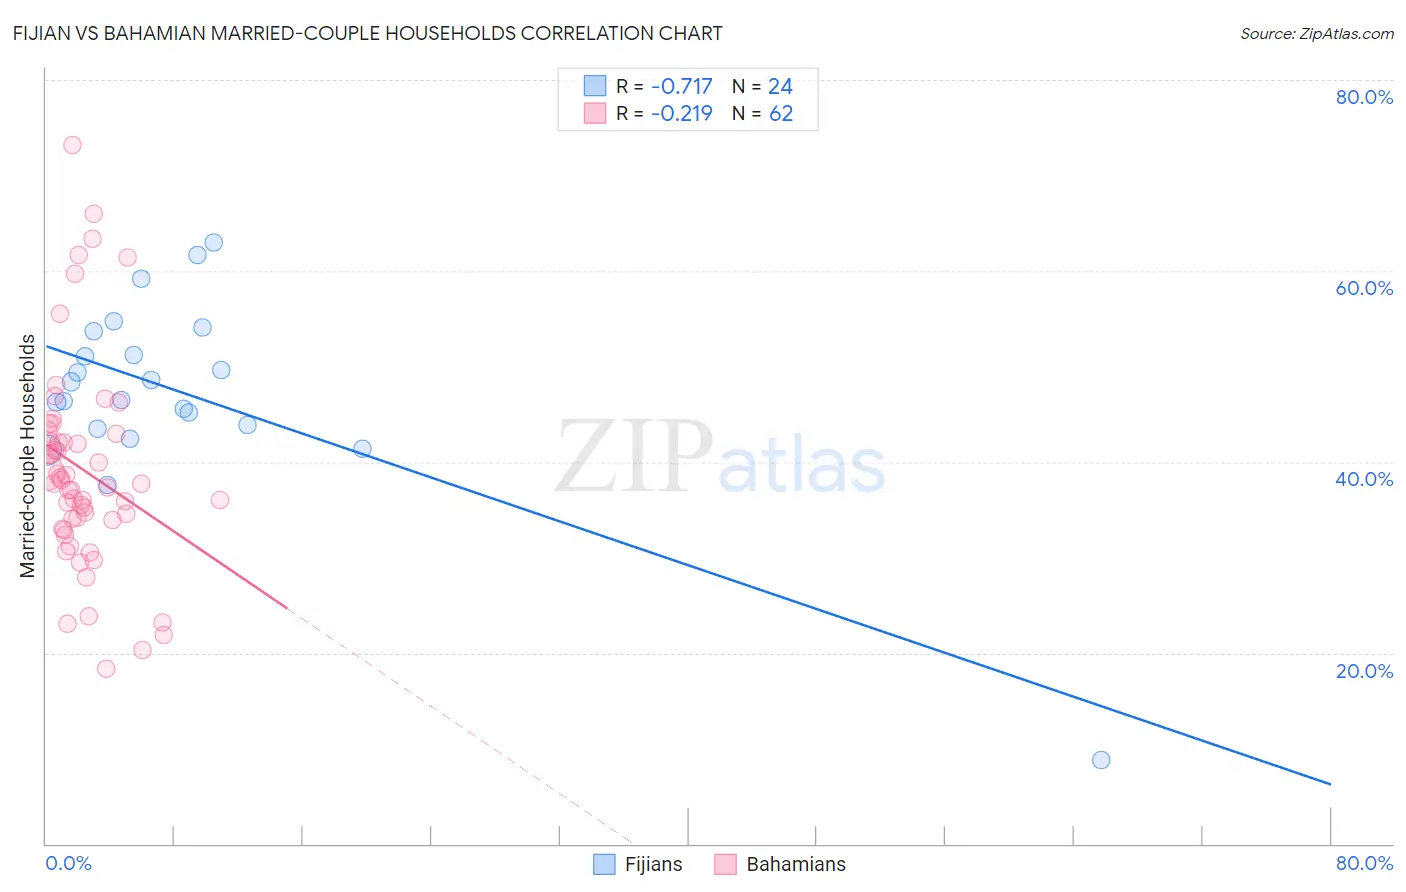
Fijian vs Bahamian Married-couple Households Correlation Chart
The statistical analysis conducted on geographies consisting of 55,947,966 people shows a strong negative correlation between the proportion of Fijians and percentage of married-couple family households in the United States with a correlation coefficient (R) of -0.717 and weighted average of 46.1%. Similarly, the statistical analysis conducted on geographies consisting of 112,634,221 people shows a weak negative correlation between the proportion of Bahamians and percentage of married-couple family households in the United States with a correlation coefficient (R) of -0.219 and weighted average of 40.5%, a difference of 13.7%.
Married-couple Households Correlation Summary
| Measurement | Fijian | Bahamian |
| Minimum | 8.8% | 18.4% |
| Maximum | 63.0% | 73.1% |
| Range | 54.2% | 54.8% |
| Mean | 47.2% | 39.2% |
| Median | 47.5% | 37.7% |
| Interquartile 25% (IQ1) | 43.7% | 33.9% |
| Interquartile 75% (IQ3) | 52.4% | 42.9% |
| Interquartile Range (IQR) | 8.7% | 9.0% |
| Standard Deviation (Sample) | 10.4% | 10.9% |
| Standard Deviation (Population) | 10.2% | 10.8% |
Similar Demographics by Married-couple Households
Demographics Similar to Fijians by Married-couple Households
In terms of married-couple households, the demographic groups most similar to Fijians are South American Indian (46.0%, a difference of 0.040%), Albanian (46.1%, a difference of 0.080%), Immigrants from Latvia (46.0%, a difference of 0.11%), Immigrants from Kuwait (46.0%, a difference of 0.18%), and Choctaw (46.0%, a difference of 0.21%).
| Demographics | Rating | Rank | Married-couple Households |
| Mongolians | 42.0 /100 | #180 | Average 46.3% |
| Malaysians | 41.8 /100 | #181 | Average 46.3% |
| Yugoslavians | 38.9 /100 | #182 | Fair 46.2% |
| Immigrants | Brazil | 38.3 /100 | #183 | Fair 46.2% |
| Immigrants | Switzerland | 36.9 /100 | #184 | Fair 46.2% |
| Brazilians | 35.9 /100 | #185 | Fair 46.2% |
| Albanians | 31.1 /100 | #186 | Fair 46.1% |
| Fijians | 29.2 /100 | #187 | Fair 46.1% |
| South American Indians | 28.4 /100 | #188 | Fair 46.0% |
| Immigrants | Latvia | 26.9 /100 | #189 | Fair 46.0% |
| Immigrants | Kuwait | 25.6 /100 | #190 | Fair 46.0% |
| Choctaw | 24.9 /100 | #191 | Fair 46.0% |
| Immigrants | Northern Africa | 24.6 /100 | #192 | Fair 46.0% |
| Taiwanese | 23.4 /100 | #193 | Fair 45.9% |
| Mexican American Indians | 23.3 /100 | #194 | Fair 45.9% |
Demographics Similar to Bahamians by Married-couple Households
In terms of married-couple households, the demographic groups most similar to Bahamians are Liberian (40.7%, a difference of 0.35%), Immigrants from Jamaica (40.7%, a difference of 0.36%), West Indian (40.3%, a difference of 0.42%), Immigrants from Liberia (40.3%, a difference of 0.45%), and Immigrants from Caribbean (40.8%, a difference of 0.65%).
| Demographics | Rating | Rank | Married-couple Households |
| Africans | 0.0 /100 | #312 | Tragic 40.9% |
| Immigrants | Haiti | 0.0 /100 | #313 | Tragic 40.9% |
| Jamaicans | 0.0 /100 | #314 | Tragic 40.9% |
| Trinidadians and Tobagonians | 0.0 /100 | #315 | Tragic 40.9% |
| Immigrants | Caribbean | 0.0 /100 | #316 | Tragic 40.8% |
| Immigrants | Jamaica | 0.0 /100 | #317 | Tragic 40.7% |
| Liberians | 0.0 /100 | #318 | Tragic 40.7% |
| Bahamians | 0.0 /100 | #319 | Tragic 40.5% |
| West Indians | 0.0 /100 | #320 | Tragic 40.3% |
| Immigrants | Liberia | 0.0 /100 | #321 | Tragic 40.3% |
| Immigrants | Zaire | 0.0 /100 | #322 | Tragic 40.1% |
| Puerto Ricans | 0.0 /100 | #323 | Tragic 40.1% |
| Navajo | 0.0 /100 | #324 | Tragic 40.1% |
| Pueblo | 0.0 /100 | #325 | Tragic 40.0% |
| U.S. Virgin Islanders | 0.0 /100 | #326 | Tragic 39.8% |