Fijian vs German Married-couple Households
COMPARE
Fijian
German
Married-couple Households
Married-couple Households Comparison
Fijians
Germans
46.1%
MARRIED-COUPLE HOUSEHOLDS
29.2/ 100
METRIC RATING
187th/ 347
METRIC RANK
49.2%
MARRIED-COUPLE HOUSEHOLDS
99.8/ 100
METRIC RATING
28th/ 347
METRIC RANK
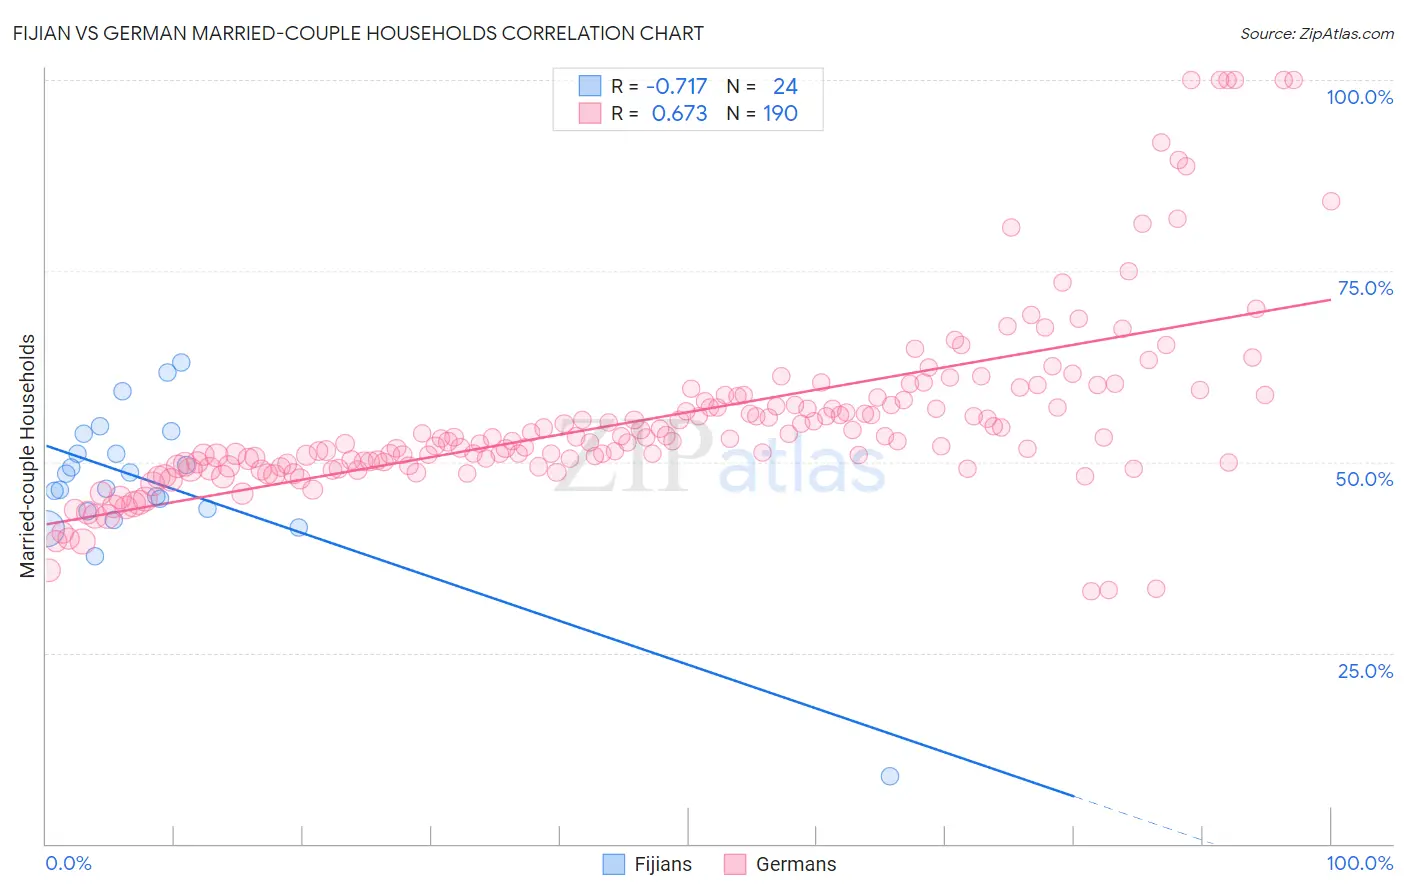
Fijian vs German Married-couple Households Correlation Chart
The statistical analysis conducted on geographies consisting of 55,947,966 people shows a strong negative correlation between the proportion of Fijians and percentage of married-couple family households in the United States with a correlation coefficient (R) of -0.717 and weighted average of 46.1%. Similarly, the statistical analysis conducted on geographies consisting of 580,558,752 people shows a significant positive correlation between the proportion of Germans and percentage of married-couple family households in the United States with a correlation coefficient (R) of 0.673 and weighted average of 49.2%, a difference of 6.8%.
Married-couple Households Correlation Summary
| Measurement | Fijian | German |
| Minimum | 8.8% | 33.1% |
| Maximum | 63.0% | 100.0% |
| Range | 54.2% | 66.9% |
| Mean | 47.2% | 55.8% |
| Median | 47.5% | 53.1% |
| Interquartile 25% (IQ1) | 43.7% | 49.7% |
| Interquartile 75% (IQ3) | 52.4% | 58.1% |
| Interquartile Range (IQR) | 8.7% | 8.4% |
| Standard Deviation (Sample) | 10.4% | 12.1% |
| Standard Deviation (Population) | 10.2% | 12.1% |
Similar Demographics by Married-couple Households
Demographics Similar to Fijians by Married-couple Households
In terms of married-couple households, the demographic groups most similar to Fijians are South American Indian (46.0%, a difference of 0.040%), Albanian (46.1%, a difference of 0.080%), Immigrants from Latvia (46.0%, a difference of 0.11%), Immigrants from Kuwait (46.0%, a difference of 0.18%), and Choctaw (46.0%, a difference of 0.21%).
| Demographics | Rating | Rank | Married-couple Households |
| Mongolians | 42.0 /100 | #180 | Average 46.3% |
| Malaysians | 41.8 /100 | #181 | Average 46.3% |
| Yugoslavians | 38.9 /100 | #182 | Fair 46.2% |
| Immigrants | Brazil | 38.3 /100 | #183 | Fair 46.2% |
| Immigrants | Switzerland | 36.9 /100 | #184 | Fair 46.2% |
| Brazilians | 35.9 /100 | #185 | Fair 46.2% |
| Albanians | 31.1 /100 | #186 | Fair 46.1% |
| Fijians | 29.2 /100 | #187 | Fair 46.1% |
| South American Indians | 28.4 /100 | #188 | Fair 46.0% |
| Immigrants | Latvia | 26.9 /100 | #189 | Fair 46.0% |
| Immigrants | Kuwait | 25.6 /100 | #190 | Fair 46.0% |
| Choctaw | 24.9 /100 | #191 | Fair 46.0% |
| Immigrants | Northern Africa | 24.6 /100 | #192 | Fair 46.0% |
| Taiwanese | 23.4 /100 | #193 | Fair 45.9% |
| Mexican American Indians | 23.3 /100 | #194 | Fair 45.9% |
Demographics Similar to Germans by Married-couple Households
In terms of married-couple households, the demographic groups most similar to Germans are Maltese (49.2%, a difference of 0.010%), Bolivian (49.2%, a difference of 0.020%), Native Hawaiian (49.1%, a difference of 0.13%), Bhutanese (49.3%, a difference of 0.19%), and Hungarian (49.1%, a difference of 0.19%).
| Demographics | Rating | Rank | Married-couple Households |
| Norwegians | 99.9 /100 | #21 | Exceptional 49.5% |
| Asians | 99.9 /100 | #22 | Exceptional 49.5% |
| Dutch | 99.9 /100 | #23 | Exceptional 49.5% |
| Czechs | 99.9 /100 | #24 | Exceptional 49.4% |
| Immigrants | Philippines | 99.9 /100 | #25 | Exceptional 49.3% |
| Immigrants | Scotland | 99.8 /100 | #26 | Exceptional 49.3% |
| Bhutanese | 99.8 /100 | #27 | Exceptional 49.3% |
| Germans | 99.8 /100 | #28 | Exceptional 49.2% |
| Maltese | 99.8 /100 | #29 | Exceptional 49.2% |
| Bolivians | 99.8 /100 | #30 | Exceptional 49.2% |
| Native Hawaiians | 99.8 /100 | #31 | Exceptional 49.1% |
| Hungarians | 99.8 /100 | #32 | Exceptional 49.1% |
| Immigrants | Asia | 99.7 /100 | #33 | Exceptional 49.1% |
| Italians | 99.7 /100 | #34 | Exceptional 49.0% |
| Scottish | 99.7 /100 | #35 | Exceptional 49.0% |