Ute vs Immigrants from Hungary Disability Age Under 5

COMPARE

Ute
Race
Ancestry
AfghanAfricanAlaska NativeAlaskan AthabascanAlbanianAleutAlsatianAmericanApacheArabArapahoArgentineanArmenianAssyrian/Chaldean/SyriacAustralianAustrianBahamianBangladeshiBarbadianBasqueBelgianBelizeanBermudanBhutaneseBlackfeetBolivianBrazilianBritishBritish West IndianBulgarianBurmeseCajunCambodianCanadianCape VerdeanCarpatho RusynCelticCentral AmericanCentral American IndianCherokeeCheyenneChickasawChileanChineseChippewaChoctawColombianColvilleComancheCosta RicanCreeCreekCroatianCrowCubanCypriotCzechCzechoslovakianDanishDelawareDominicanDutchDutch West IndianEastern EuropeanEcuadorianEgyptianEnglishEstonianEthiopianEuropeanFijianFilipinoFinnishFrenchFrench American IndianFrench CanadianGermanGerman RussianGhanaianGreekGuamanian/ChamorroGuatemalanGuyaneseHaitianHmongHonduranHopiHoumaHungarianIcelanderIndian (Asian)IndonesianInupiatIranianIraqiIrishIroquoisIsraeliItalianJamaicanJapaneseJordanianKenyanKiowaKoreanLaotianLatvianLebaneseLiberianLithuanianLumbeeLuxembourgerMacedonianMalaysianMalteseMarshalleseMenomineeMexicanMexican American IndianMongolianMoroccanNative HawaiianNavajoNepaleseNew ZealanderNicaraguanNigerianNorthern EuropeanNorwegianOkinawanOsageOttawaPaiutePakistaniPalestinianPanamanianParaguayanPennsylvania GermanPeruvianPimaPolishPortuguesePotawatomiPuebloPuerto RicanPuget Sound SalishRomanianRussianSalvadoranSamoanScandinavianScotch-IrishScottishSeminoleSenegaleseSerbianShoshoneSierra LeoneanSiouxSlavicSlovakSloveneSomaliSouth AfricanSouth AmericanSouth American IndianSoviet UnionSpaniardSpanishSpanish AmericanSpanish American IndianSri LankanSubsaharan AfricanSudaneseSwedishSwissSyrianTaiwaneseThaiTlingit-HaidaTohono O'OdhamTonganTrinidadian and TobagonianTsimshianTurkishU.S. Virgin IslanderUgandanUkrainianUruguayanUteVenezuelanVietnameseWelshWest IndianYakamaYaquiYugoslavianYumanYup'ikZimbabwean
Immigration
NonimmigrantsImmigrantsAfghanistanAfricaAlbaniaArgentinaArmeniaAsiaAustraliaAustriaBahamasBangladeshBarbadosBelarusBelgiumBelizeBoliviaBosnia and HerzegovinaBrazilBulgariaBurma/MyanmarCabo VerdeCambodiaCameroonCanadaCaribbeanCentral AmericaChileChinaColombiaCongoCosta RicaCroatiaCubaCzechoslovakiaDenmarkDominicaDominican RepublicEastern AfricaEastern AsiaEastern EuropeEcuadorEgyptEl SalvadorEnglandEritreaEthiopiaEuropeFijiFranceGermanyGhanaGreeceGrenadaGuatemalaGuyanaHaitiHondurasHong KongIndiaIndonesiaIranIraqIrelandIsraelItalyJamaicaJapanJordanKazakhstanKenyaKoreaKuwaitLaosLatin AmericaLatviaLebanonLiberiaLithuaniaMalaysiaMexicoMicronesiaMiddle AfricaMoldovaMoroccoNepalNetherlandsNicaraguaNigeriaNorth AmericaNorth MacedoniaNorthern AfricaNorthern EuropeNorwayOceaniaPakistanPanamaPeruPhilippinesPolandPortugalRomaniaRussiaSaudi ArabiaScotlandSenegalSerbiaSierra LeoneSingaporeSomaliaSouth AfricaSouth AmericaSouth Central AsiaSouth Eastern AsiaSouthern EuropeSpainSri LankaSt. Vincent and the GrenadinesSudanSwedenSwitzerlandSyriaTaiwanThailandTrinidad and TobagoTurkeyUgandaUkraineUruguayUzbekistanVenezuelaVietnamWest IndiesWestern AfricaWestern AsiaWestern EuropeYemenZaireZimbabweAzores
Immigrants from Hungary
Race
Ancestry
AfghanAfricanAlaska NativeAlaskan AthabascanAlbanianAleutAlsatianAmericanApacheArabArapahoArgentineanArmenianAssyrian/Chaldean/SyriacAustralianAustrianBahamianBangladeshiBarbadianBasqueBelgianBelizeanBermudanBhutaneseBlackfeetBolivianBrazilianBritishBritish West IndianBulgarianBurmeseCajunCambodianCanadianCape VerdeanCarpatho RusynCelticCentral AmericanCentral American IndianCherokeeCheyenneChickasawChileanChineseChippewaChoctawColombianColvilleComancheCosta RicanCreeCreekCroatianCrowCubanCypriotCzechCzechoslovakianDanishDelawareDominicanDutchDutch West IndianEastern EuropeanEcuadorianEgyptianEnglishEstonianEthiopianEuropeanFijianFilipinoFinnishFrenchFrench American IndianFrench CanadianGermanGerman RussianGhanaianGreekGuamanian/ChamorroGuatemalanGuyaneseHaitianHmongHonduranHopiHoumaHungarianIcelanderIndian (Asian)IndonesianInupiatIranianIraqiIrishIroquoisIsraeliItalianJamaicanJapaneseJordanianKenyanKiowaKoreanLaotianLatvianLebaneseLiberianLithuanianLumbeeLuxembourgerMacedonianMalaysianMalteseMarshalleseMenomineeMexicanMexican American IndianMongolianMoroccanNative HawaiianNavajoNepaleseNew ZealanderNicaraguanNigerianNorthern EuropeanNorwegianOkinawanOsageOttawaPaiutePakistaniPalestinianPanamanianParaguayanPennsylvania GermanPeruvianPimaPolishPortuguesePotawatomiPuebloPuerto RicanPuget Sound SalishRomanianRussianSalvadoranSamoanScandinavianScotch-IrishScottishSeminoleSenegaleseSerbianShoshoneSierra LeoneanSiouxSlavicSlovakSloveneSomaliSouth AfricanSouth AmericanSouth American IndianSoviet UnionSpaniardSpanishSpanish AmericanSpanish American IndianSri LankanSubsaharan AfricanSudaneseSwedishSwissSyrianTaiwaneseThaiTlingit-HaidaTohono O'OdhamTonganTrinidadian and TobagonianTsimshianTurkishU.S. Virgin IslanderUgandanUkrainianUruguayanVenezuelanVietnameseWelshWest IndianYakamaYaquiYugoslavianYumanYup'ikZimbabwean
Immigration
NonimmigrantsImmigrantsAfghanistanAfricaAlbaniaArgentinaArmeniaAsiaAustraliaAustriaBahamasBangladeshBarbadosBelarusBelgiumBelizeBoliviaBosnia and HerzegovinaBrazilBulgariaBurma/MyanmarCabo VerdeCambodiaCameroonCanadaCaribbeanCentral AmericaChileChinaColombiaCongoCosta RicaCroatiaCubaCzechoslovakiaDenmarkDominicaDominican RepublicEastern AfricaEastern AsiaEastern EuropeEcuadorEgyptEl SalvadorEnglandEritreaEthiopiaEuropeFijiFranceGermanyGhanaGreeceGrenadaGuatemalaGuyanaHaitiHondurasHong KongHungaryIndiaIndonesiaIranIraqIrelandIsraelItalyJamaicaJapanJordanKazakhstanKenyaKoreaKuwaitLaosLatin AmericaLatviaLebanonLiberiaLithuaniaMalaysiaMexicoMicronesiaMiddle AfricaMoldovaMoroccoNepalNetherlandsNicaraguaNigeriaNorth AmericaNorth MacedoniaNorthern AfricaNorthern EuropeNorwayOceaniaPakistanPanamaPeruPhilippinesPolandPortugalRomaniaRussiaSaudi ArabiaScotlandSenegalSerbiaSierra LeoneSingaporeSomaliaSouth AfricaSouth AmericaSouth Central AsiaSouth Eastern AsiaSouthern EuropeSpainSri LankaSt. Vincent and the GrenadinesSudanSwedenSwitzerlandSyriaTaiwanThailandTrinidad and TobagoTurkeyUgandaUkraineUruguayUzbekistanVenezuelaVietnamWest IndiesWestern AfricaWestern AsiaWestern EuropeYemenZaireZimbabweAzores
Disability Age Under 5
Income
Poverty
Unemployment
Labor Participation
Family Structure
Vehicle Availability
Education Level
Disability

Disability Age Under 5 Comparison

Ute

Immigrants from Hungary

Exceptional
Tragic
0.86%
DISABILITY AGE UNDER 5
100.0/ 100
METRIC RATING
6th/ 347
METRIC RANK
1.4%
DISABILITY AGE UNDER 5
1.0/ 100
METRIC RATING
251st/ 347
METRIC RANK

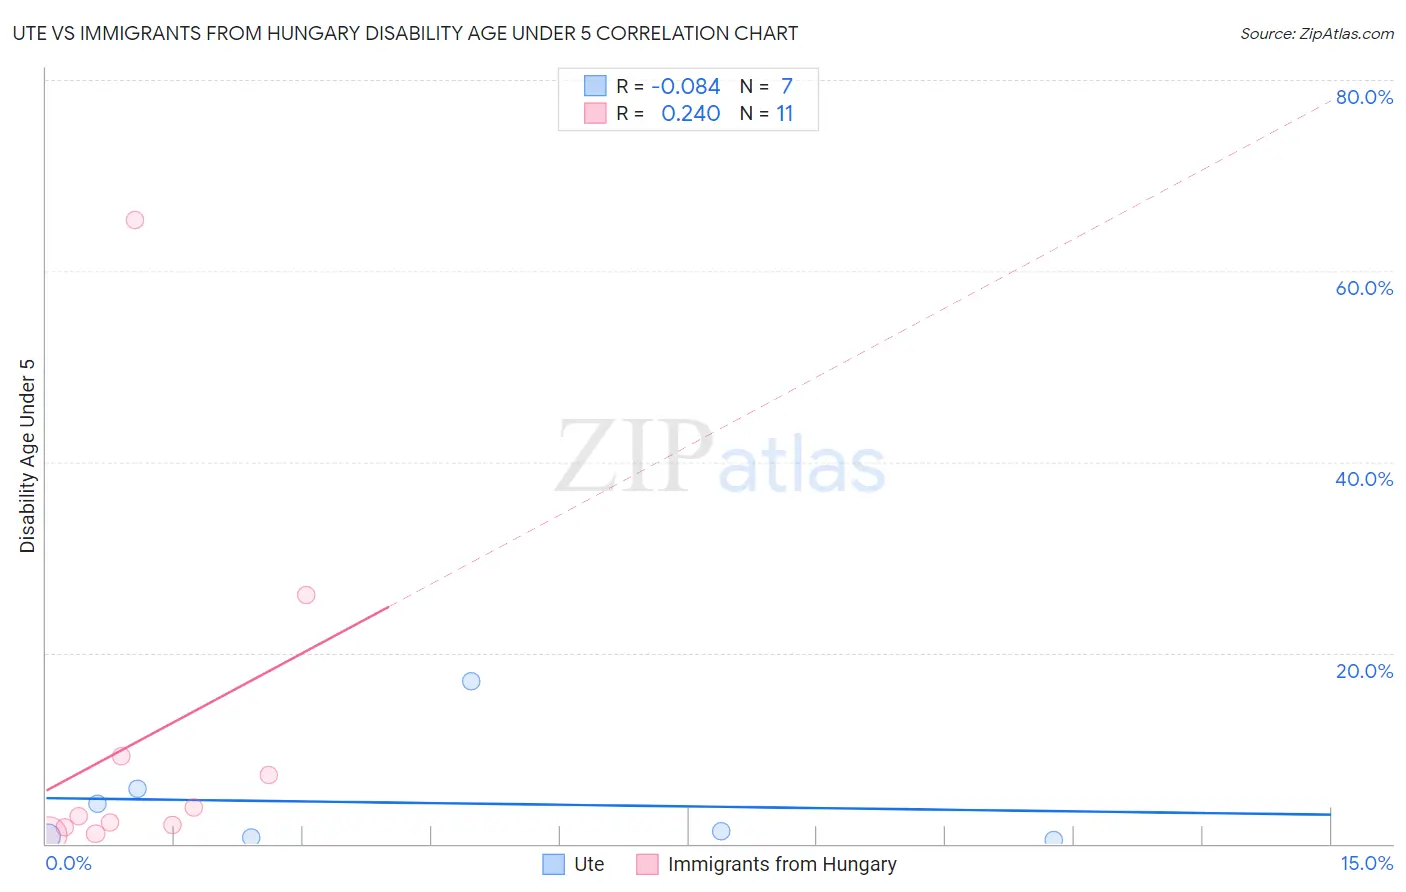
Ute vs Immigrants from Hungary Disability Age Under 5 Correlation Chart

The statistical analysis conducted on geographies consisting of 45,228,215 people shows a slight negative correlation between the proportion of Ute and percentage of population with a disability under the age of 5 in the United States with a correlation coefficient (R) of -0.084 and weighted average of 0.86%. Similarly, the statistical analysis conducted on geographies consisting of 126,295,139 people shows a weak positive correlation between the proportion of Immigrants from Hungary and percentage of population with a disability under the age of 5 in the United States with a correlation coefficient (R) of 0.240 and weighted average of 1.4%, a difference of 59.2%.
Ute vs Immigrants from Hungary Disability Age Under 5

Disability Age Under 5 Correlation Summary

MeasurementUteImmigrants from Hungary
Minimum0.45%0.96%
Maximum17.1%65.4%
Range16.6%64.4%
Mean4.3%11.1%
Median1.3%2.9%
Interquartile 25% (IQ1)0.70%1.8%
Interquartile 75% (IQ3)5.7%9.2%
Interquartile Range (IQR)5.0%7.4%
Standard Deviation (Sample)6.0%19.4%
Standard Deviation (Population)5.5%18.5%

Similar Demographics by Disability Age Under 5

Demographics Similar to Ute by Disability Age Under 5

In terms of disability age under 5, the demographic groups most similar to Ute are Immigrants from Bangladesh (0.85%, a difference of 0.93%), Immigrants from Uzbekistan (0.85%, a difference of 1.3%), Immigrants from Afghanistan (0.91%, a difference of 5.3%), Immigrants from Yemen (0.91%, a difference of 5.4%), and Vietnamese (0.81%, a difference of 6.0%).
DemographicsRating | RankDisability Age Under 5
Immigrants | Armenia
100.0
/100
|
#1
Exceptional
0.76%
Immigrants | St. Vincent and the Grenadines
100.0
/100
|
#2
Exceptional
0.79%
Vietnamese
100.0
/100
|
#3
Exceptional
0.81%
Immigrants | Uzbekistan
100.0
/100
|
#4
Exceptional
0.85%
Immigrants | Bangladesh
100.0
/100
|
#5
Exceptional
0.85%
Ute
100.0
/100
|
#6
Exceptional
0.86%
Immigrants | Afghanistan
100.0
/100
|
#7
Exceptional
0.91%
Immigrants | Yemen
100.0
/100
|
#8
Exceptional
0.91%
Immigrants | Fiji
100.0
/100
|
#9
Exceptional
0.92%
Marshallese
100.0
/100
|
#10
Exceptional
0.94%
Afghans
100.0
/100
|
#11
Exceptional
0.94%
Immigrants | Grenada
100.0
/100
|
#12
Exceptional
0.94%
Soviet Union
100.0
/100
|
#13
Exceptional
0.95%
Yuman
100.0
/100
|
#14
Exceptional
0.95%
Immigrants | Hong Kong
100.0
/100
|
#15
Exceptional
0.95%

Demographics Similar to Immigrants from Hungary by Disability Age Under 5

In terms of disability age under 5, the demographic groups most similar to Immigrants from Hungary are African (1.4%, a difference of 0.030%), Bermudan (1.4%, a difference of 0.040%), Immigrants from Scotland (1.4%, a difference of 0.040%), Eastern European (1.4%, a difference of 0.12%), and Immigrants from England (1.4%, a difference of 0.15%).
DemographicsRating | RankDisability Age Under 5
Spaniards
1.4
/100
|
#244
Tragic
1.4%
Potawatomi
1.1
/100
|
#245
Tragic
1.4%
Russians
1.0
/100
|
#246
Tragic
1.4%
Immigrants | England
1.0
/100
|
#247
Tragic
1.4%
Eastern Europeans
1.0
/100
|
#248
Tragic
1.4%
Bermudans
1.0
/100
|
#249
Tragic
1.4%
Africans
1.0
/100
|
#250
Tragic
1.4%
Immigrants | Hungary
1.0
/100
|
#251
Tragic
1.4%
Immigrants | Scotland
0.9
/100
|
#252
Tragic
1.4%
Australians
0.7
/100
|
#253
Tragic
1.4%
Immigrants | Brazil
0.7
/100
|
#254
Tragic
1.4%
Immigrants | Liberia
0.6
/100
|
#255
Tragic
1.4%
Immigrants | Western Europe
0.5
/100
|
#256
Tragic
1.4%
Slovenes
0.3
/100
|
#257
Tragic
1.4%
Costa Ricans
0.3
/100
|
#258
Tragic
1.4%