Tsimshian vs Immigrants from Nigeria Female Disability

COMPARE

Tsimshian
Race
Ancestry
AfghanAfricanAlaska NativeAlaskan AthabascanAlbanianAleutAlsatianAmericanApacheArabArapahoArgentineanArmenianAssyrian/Chaldean/SyriacAustralianAustrianBahamianBangladeshiBarbadianBasqueBelgianBelizeanBermudanBhutaneseBlackfeetBolivianBrazilianBritishBritish West IndianBulgarianBurmeseCajunCambodianCanadianCape VerdeanCarpatho RusynCelticCentral AmericanCentral American IndianCherokeeCheyenneChickasawChileanChineseChippewaChoctawColombianColvilleComancheCosta RicanCreeCreekCroatianCrowCubanCypriotCzechCzechoslovakianDanishDelawareDominicanDutchDutch West IndianEastern EuropeanEcuadorianEgyptianEnglishEstonianEthiopianEuropeanFijianFilipinoFinnishFrenchFrench American IndianFrench CanadianGermanGerman RussianGhanaianGreekGuamanian/ChamorroGuatemalanGuyaneseHaitianHmongHonduranHopiHoumaHungarianIcelanderIndian (Asian)IndonesianInupiatIranianIraqiIrishIroquoisIsraeliItalianJamaicanJapaneseJordanianKenyanKiowaKoreanLaotianLatvianLebaneseLiberianLithuanianLumbeeLuxembourgerMacedonianMalaysianMalteseMarshalleseMenomineeMexicanMexican American IndianMongolianMoroccanNative HawaiianNavajoNepaleseNew ZealanderNicaraguanNigerianNorthern EuropeanNorwegianOkinawanOsageOttawaPaiutePakistaniPalestinianPanamanianParaguayanPennsylvania GermanPeruvianPimaPolishPortuguesePotawatomiPuebloPuerto RicanPuget Sound SalishRomanianRussianSalvadoranSamoanScandinavianScotch-IrishScottishSeminoleSenegaleseSerbianShoshoneSierra LeoneanSiouxSlavicSlovakSloveneSomaliSouth AfricanSouth AmericanSouth American IndianSoviet UnionSpaniardSpanishSpanish AmericanSpanish American IndianSri LankanSubsaharan AfricanSudaneseSwedishSwissSyrianTaiwaneseThaiTlingit-HaidaTohono O'OdhamTonganTrinidadian and TobagonianTsimshianTurkishU.S. Virgin IslanderUgandanUkrainianUruguayanUteVenezuelanVietnameseWelshWest IndianYakamaYaquiYugoslavianYumanYup'ikZimbabwean
Immigration
NonimmigrantsImmigrantsAfghanistanAfricaAlbaniaArgentinaArmeniaAsiaAustraliaAustriaBahamasBangladeshBarbadosBelarusBelgiumBelizeBoliviaBosnia and HerzegovinaBrazilBulgariaBurma/MyanmarCabo VerdeCambodiaCameroonCanadaCaribbeanCentral AmericaChileChinaColombiaCongoCosta RicaCroatiaCubaCzechoslovakiaDenmarkDominicaDominican RepublicEastern AfricaEastern AsiaEastern EuropeEcuadorEgyptEl SalvadorEnglandEritreaEthiopiaEuropeFijiFranceGermanyGhanaGreeceGrenadaGuatemalaGuyanaHaitiHondurasHong KongHungaryIndiaIndonesiaIranIraqIrelandIsraelItalyJamaicaJapanJordanKazakhstanKenyaKoreaKuwaitLaosLatin AmericaLatviaLebanonLiberiaLithuaniaMalaysiaMexicoMicronesiaMiddle AfricaMoldovaMoroccoNepalNetherlandsNicaraguaNorth AmericaNorth MacedoniaNorthern AfricaNorthern EuropeNorwayOceaniaPakistanPanamaPeruPhilippinesPolandPortugalRomaniaRussiaSaudi ArabiaScotlandSenegalSerbiaSierra LeoneSingaporeSomaliaSouth AfricaSouth AmericaSouth Central AsiaSouth Eastern AsiaSouthern EuropeSpainSri LankaSt. Vincent and the GrenadinesSudanSwedenSwitzerlandSyriaTaiwanThailandTrinidad and TobagoTurkeyUgandaUkraineUruguayUzbekistanVenezuelaVietnamWest IndiesWestern AfricaWestern AsiaWestern EuropeYemenZaireZimbabweAzores
Immigrants from Nigeria
Race
Ancestry
AfghanAfricanAlaska NativeAlaskan AthabascanAlbanianAleutAlsatianAmericanApacheArabArapahoArgentineanArmenianAssyrian/Chaldean/SyriacAustralianAustrianBahamianBangladeshiBarbadianBasqueBelgianBelizeanBermudanBhutaneseBlackfeetBolivianBrazilianBritishBritish West IndianBulgarianBurmeseCajunCambodianCanadianCape VerdeanCarpatho RusynCelticCentral AmericanCentral American IndianCherokeeCheyenneChickasawChileanChineseChippewaChoctawColombianColvilleComancheCosta RicanCreeCreekCroatianCrowCubanCypriotCzechCzechoslovakianDanishDelawareDominicanDutchDutch West IndianEastern EuropeanEcuadorianEgyptianEnglishEstonianEthiopianEuropeanFijianFilipinoFinnishFrenchFrench American IndianFrench CanadianGermanGerman RussianGhanaianGreekGuamanian/ChamorroGuatemalanGuyaneseHaitianHmongHonduranHopiHoumaHungarianIcelanderIndian (Asian)IndonesianInupiatIranianIraqiIrishIroquoisIsraeliItalianJamaicanJapaneseJordanianKenyanKiowaKoreanLaotianLatvianLebaneseLiberianLithuanianLumbeeLuxembourgerMacedonianMalaysianMalteseMarshalleseMenomineeMexicanMexican American IndianMongolianMoroccanNative HawaiianNavajoNepaleseNew ZealanderNicaraguanNigerianNorthern EuropeanNorwegianOkinawanOsageOttawaPaiutePakistaniPalestinianPanamanianParaguayanPennsylvania GermanPeruvianPimaPolishPortuguesePotawatomiPuebloPuerto RicanPuget Sound SalishRomanianRussianSalvadoranSamoanScandinavianScotch-IrishScottishSeminoleSenegaleseSerbianShoshoneSierra LeoneanSiouxSlavicSlovakSloveneSomaliSouth AfricanSouth AmericanSouth American IndianSoviet UnionSpaniardSpanishSpanish AmericanSpanish American IndianSri LankanSubsaharan AfricanSudaneseSwedishSwissSyrianTaiwaneseThaiTlingit-HaidaTohono O'OdhamTonganTrinidadian and TobagonianTurkishU.S. Virgin IslanderUgandanUkrainianUruguayanUteVenezuelanVietnameseWelshWest IndianYakamaYaquiYugoslavianYumanYup'ikZimbabwean
Immigration
NonimmigrantsImmigrantsAfghanistanAfricaAlbaniaArgentinaArmeniaAsiaAustraliaAustriaBahamasBangladeshBarbadosBelarusBelgiumBelizeBoliviaBosnia and HerzegovinaBrazilBulgariaBurma/MyanmarCabo VerdeCambodiaCameroonCanadaCaribbeanCentral AmericaChileChinaColombiaCongoCosta RicaCroatiaCubaCzechoslovakiaDenmarkDominicaDominican RepublicEastern AfricaEastern AsiaEastern EuropeEcuadorEgyptEl SalvadorEnglandEritreaEthiopiaEuropeFijiFranceGermanyGhanaGreeceGrenadaGuatemalaGuyanaHaitiHondurasHong KongHungaryIndiaIndonesiaIranIraqIrelandIsraelItalyJamaicaJapanJordanKazakhstanKenyaKoreaKuwaitLaosLatin AmericaLatviaLebanonLiberiaLithuaniaMalaysiaMexicoMicronesiaMiddle AfricaMoldovaMoroccoNepalNetherlandsNicaraguaNigeriaNorth AmericaNorth MacedoniaNorthern AfricaNorthern EuropeNorwayOceaniaPakistanPanamaPeruPhilippinesPolandPortugalRomaniaRussiaSaudi ArabiaScotlandSenegalSerbiaSierra LeoneSingaporeSomaliaSouth AfricaSouth AmericaSouth Central AsiaSouth Eastern AsiaSouthern EuropeSpainSri LankaSt. Vincent and the GrenadinesSudanSwedenSwitzerlandSyriaTaiwanThailandTrinidad and TobagoTurkeyUgandaUkraineUruguayUzbekistanVenezuelaVietnamWest IndiesWestern AfricaWestern AsiaWestern EuropeYemenZaireZimbabweAzores
Female Disability
Income
Poverty
Unemployment
Labor Participation
Family Structure
Vehicle Availability
Education Level
Disability

Female Disability Comparison

Tsimshian

Immigrants from Nigeria

Tragic
Exceptional
16.8%
FEMALE DISABILITY
0.0/ 100
METRIC RATING
346th/ 347
METRIC RANK
11.8%
FEMALE DISABILITY
97.2/ 100
METRIC RATING
118th/ 347
METRIC RANK

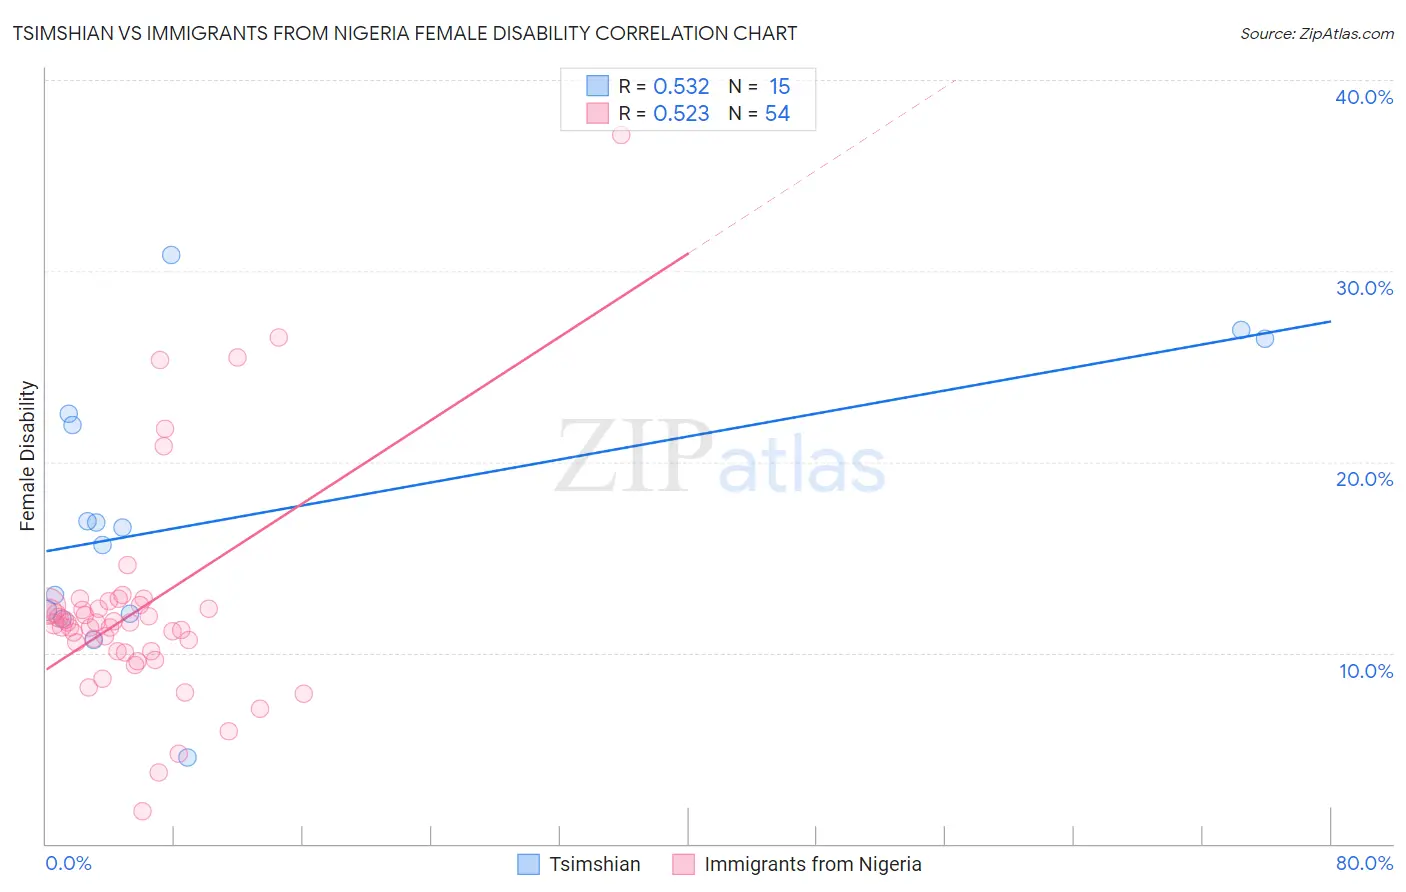
Tsimshian vs Immigrants from Nigeria Female Disability Correlation Chart

The statistical analysis conducted on geographies consisting of 15,626,462 people shows a substantial positive correlation between the proportion of Tsimshian and percentage of females with a disability in the United States with a correlation coefficient (R) of 0.532 and weighted average of 16.8%. Similarly, the statistical analysis conducted on geographies consisting of 283,471,855 people shows a substantial positive correlation between the proportion of Immigrants from Nigeria and percentage of females with a disability in the United States with a correlation coefficient (R) of 0.523 and weighted average of 11.8%, a difference of 42.3%.
Tsimshian vs Immigrants from Nigeria Female Disability

Female Disability Correlation Summary

MeasurementTsimshianImmigrants from Nigeria
Minimum4.5%1.7%
Maximum30.9%37.1%
Range26.4%35.4%
Mean17.3%12.3%
Median16.6%11.5%
Interquartile 25% (IQ1)12.0%10.1%
Interquartile 75% (IQ3)22.5%12.4%
Interquartile Range (IQR)10.5%2.3%
Standard Deviation (Sample)7.2%5.8%
Standard Deviation (Population)6.9%5.7%

Similar Demographics by Female Disability

Demographics Similar to Tsimshian by Female Disability

In terms of female disability, the demographic groups most similar to Tsimshian are Houma (16.9%, a difference of 0.77%), Puerto Rican (16.6%, a difference of 0.94%), Kiowa (15.8%, a difference of 6.2%), Lumbee (15.8%, a difference of 6.3%), and Creek (15.7%, a difference of 7.1%).
DemographicsRating | RankFemale Disability
Immigrants | Azores
0.0
/100
|
#333
Tragic
14.9%
Cherokee
0.0
/100
|
#334
Tragic
14.9%
Cajuns
0.0
/100
|
#335
Tragic
14.9%
Seminole
0.0
/100
|
#336
Tragic
15.0%
Tohono O'odham
0.0
/100
|
#337
Tragic
15.0%
Dutch West Indians
0.0
/100
|
#338
Tragic
15.0%
Colville
0.0
/100
|
#339
Tragic
15.1%
Chickasaw
0.0
/100
|
#340
Tragic
15.2%
Choctaw
0.0
/100
|
#341
Tragic
15.4%
Creek
0.0
/100
|
#342
Tragic
15.7%
Lumbee
0.0
/100
|
#343
Tragic
15.8%
Kiowa
0.0
/100
|
#344
Tragic
15.8%
Puerto Ricans
0.0
/100
|
#345
Tragic
16.6%
Tsimshian
0.0
/100
|
#346
Tragic
16.8%
Houma
0.0
/100
|
#347
Tragic
16.9%

Demographics Similar to Immigrants from Nigeria by Female Disability

In terms of female disability, the demographic groups most similar to Immigrants from Nigeria are Immigrants from Eastern Europe (11.8%, a difference of 0.0%), Immigrants from Uganda (11.8%, a difference of 0.010%), Immigrants from Kazakhstan (11.8%, a difference of 0.090%), Immigrants from Netherlands (11.8%, a difference of 0.11%), and Immigrants from North Macedonia (11.8%, a difference of 0.12%).
DemographicsRating | RankFemale Disability
Costa Ricans
98.1
/100
|
#111
Exceptional
11.7%
Immigrants | Bangladesh
97.8
/100
|
#112
Exceptional
11.8%
Immigrants | Belarus
97.8
/100
|
#113
Exceptional
11.8%
South Africans
97.7
/100
|
#114
Exceptional
11.8%
Brazilians
97.7
/100
|
#115
Exceptional
11.8%
Immigrants | Morocco
97.6
/100
|
#116
Exceptional
11.8%
Immigrants | Eastern Europe
97.2
/100
|
#117
Exceptional
11.8%
Immigrants | Nigeria
97.2
/100
|
#118
Exceptional
11.8%
Immigrants | Uganda
97.2
/100
|
#119
Exceptional
11.8%
Immigrants | Kazakhstan
97.0
/100
|
#120
Exceptional
11.8%
Immigrants | Netherlands
96.9
/100
|
#121
Exceptional
11.8%
Immigrants | North Macedonia
96.8
/100
|
#122
Exceptional
11.8%
Immigrants | Croatia
96.7
/100
|
#123
Exceptional
11.8%
Russians
96.5
/100
|
#124
Exceptional
11.8%
Immigrants | Italy
96.4
/100
|
#125
Exceptional
11.8%