Tsimshian vs Immigrants from Thailand Female Disability
COMPARE
Tsimshian
Immigrants from Thailand
Female Disability
Female Disability Comparison
Tsimshian
Immigrants from Thailand
16.8%
FEMALE DISABILITY
0.0/ 100
METRIC RATING
346th/ 347
METRIC RANK
12.4%
FEMALE DISABILITY
14.5/ 100
METRIC RATING
213th/ 347
METRIC RANK
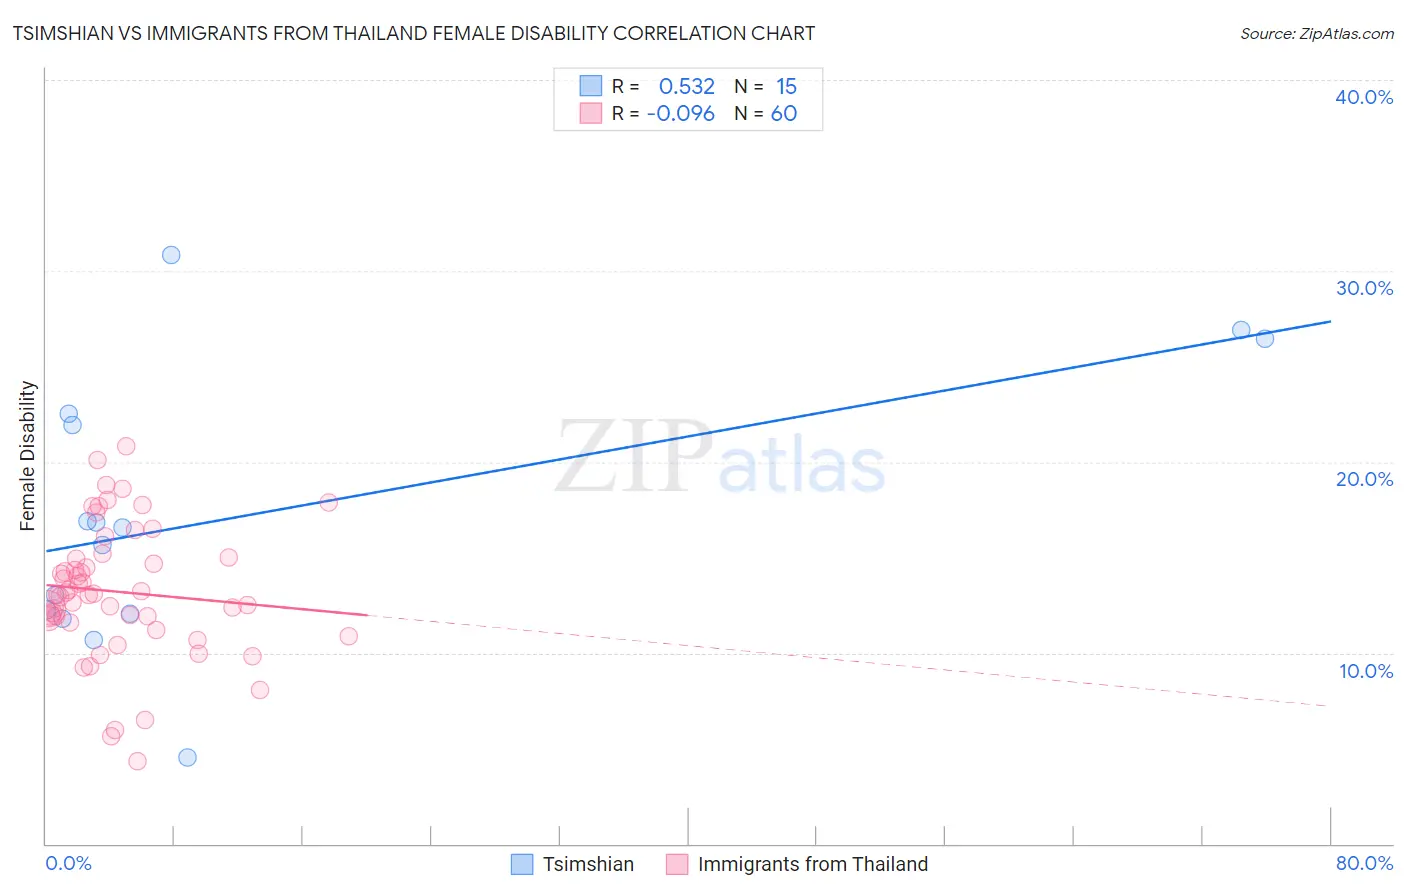
Tsimshian vs Immigrants from Thailand Female Disability Correlation Chart
The statistical analysis conducted on geographies consisting of 15,626,462 people shows a substantial positive correlation between the proportion of Tsimshian and percentage of females with a disability in the United States with a correlation coefficient (R) of 0.532 and weighted average of 16.8%. Similarly, the statistical analysis conducted on geographies consisting of 316,982,742 people shows a slight negative correlation between the proportion of Immigrants from Thailand and percentage of females with a disability in the United States with a correlation coefficient (R) of -0.096 and weighted average of 12.4%, a difference of 35.3%.
Female Disability Correlation Summary
| Measurement | Tsimshian | Immigrants from Thailand |
| Minimum | 4.5% | 4.3% |
| Maximum | 30.9% | 20.8% |
| Range | 26.4% | 16.5% |
| Mean | 17.3% | 13.2% |
| Median | 16.6% | 13.1% |
| Interquartile 25% (IQ1) | 12.0% | 11.7% |
| Interquartile 75% (IQ3) | 22.5% | 15.0% |
| Interquartile Range (IQR) | 10.5% | 3.3% |
| Standard Deviation (Sample) | 7.2% | 3.5% |
| Standard Deviation (Population) | 6.9% | 3.4% |
Similar Demographics by Female Disability
Demographics Similar to Tsimshian by Female Disability
In terms of female disability, the demographic groups most similar to Tsimshian are Houma (16.9%, a difference of 0.77%), Puerto Rican (16.6%, a difference of 0.94%), Kiowa (15.8%, a difference of 6.2%), Lumbee (15.8%, a difference of 6.3%), and Creek (15.7%, a difference of 7.1%).
| Demographics | Rating | Rank | Female Disability |
| Immigrants | Azores | 0.0 /100 | #333 | Tragic 14.9% |
| Cherokee | 0.0 /100 | #334 | Tragic 14.9% |
| Cajuns | 0.0 /100 | #335 | Tragic 14.9% |
| Seminole | 0.0 /100 | #336 | Tragic 15.0% |
| Tohono O'odham | 0.0 /100 | #337 | Tragic 15.0% |
| Dutch West Indians | 0.0 /100 | #338 | Tragic 15.0% |
| Colville | 0.0 /100 | #339 | Tragic 15.1% |
| Chickasaw | 0.0 /100 | #340 | Tragic 15.2% |
| Choctaw | 0.0 /100 | #341 | Tragic 15.4% |
| Creek | 0.0 /100 | #342 | Tragic 15.7% |
| Lumbee | 0.0 /100 | #343 | Tragic 15.8% |
| Kiowa | 0.0 /100 | #344 | Tragic 15.8% |
| Puerto Ricans | 0.0 /100 | #345 | Tragic 16.6% |
| Tsimshian | 0.0 /100 | #346 | Tragic 16.8% |
| Houma | 0.0 /100 | #347 | Tragic 16.9% |
Demographics Similar to Immigrants from Thailand by Female Disability
In terms of female disability, the demographic groups most similar to Immigrants from Thailand are Ute (12.4%, a difference of 0.020%), Swiss (12.4%, a difference of 0.030%), Immigrants from Bosnia and Herzegovina (12.4%, a difference of 0.030%), Panamanian (12.4%, a difference of 0.080%), and Samoan (12.4%, a difference of 0.080%).
| Demographics | Rating | Rank | Female Disability |
| Immigrants | Cuba | 20.2 /100 | #206 | Fair 12.4% |
| Croatians | 20.2 /100 | #207 | Fair 12.4% |
| Basques | 17.5 /100 | #208 | Poor 12.4% |
| Mexicans | 15.7 /100 | #209 | Poor 12.4% |
| Swiss | 14.9 /100 | #210 | Poor 12.4% |
| Immigrants | Bosnia and Herzegovina | 14.8 /100 | #211 | Poor 12.4% |
| Ute | 14.7 /100 | #212 | Poor 12.4% |
| Immigrants | Thailand | 14.5 /100 | #213 | Poor 12.4% |
| Panamanians | 13.5 /100 | #214 | Poor 12.4% |
| Samoans | 13.4 /100 | #215 | Poor 12.4% |
| Immigrants | Burma/Myanmar | 13.3 /100 | #216 | Poor 12.4% |
| British | 12.7 /100 | #217 | Poor 12.4% |
| Immigrants | Bahamas | 12.5 /100 | #218 | Poor 12.4% |
| Europeans | 12.1 /100 | #219 | Poor 12.4% |
| Bahamians | 11.1 /100 | #220 | Poor 12.4% |