Tsimshian vs Immigrants from Nigeria Family Poverty
COMPARE
Tsimshian
Immigrants from Nigeria
Family Poverty
Family Poverty Comparison
Tsimshian
Immigrants from Nigeria
8.8%
FAMILY POVERTY
69.3/ 100
METRIC RATING
157th/ 347
METRIC RANK
10.2%
FAMILY POVERTY
1.9/ 100
METRIC RATING
236th/ 347
METRIC RANK
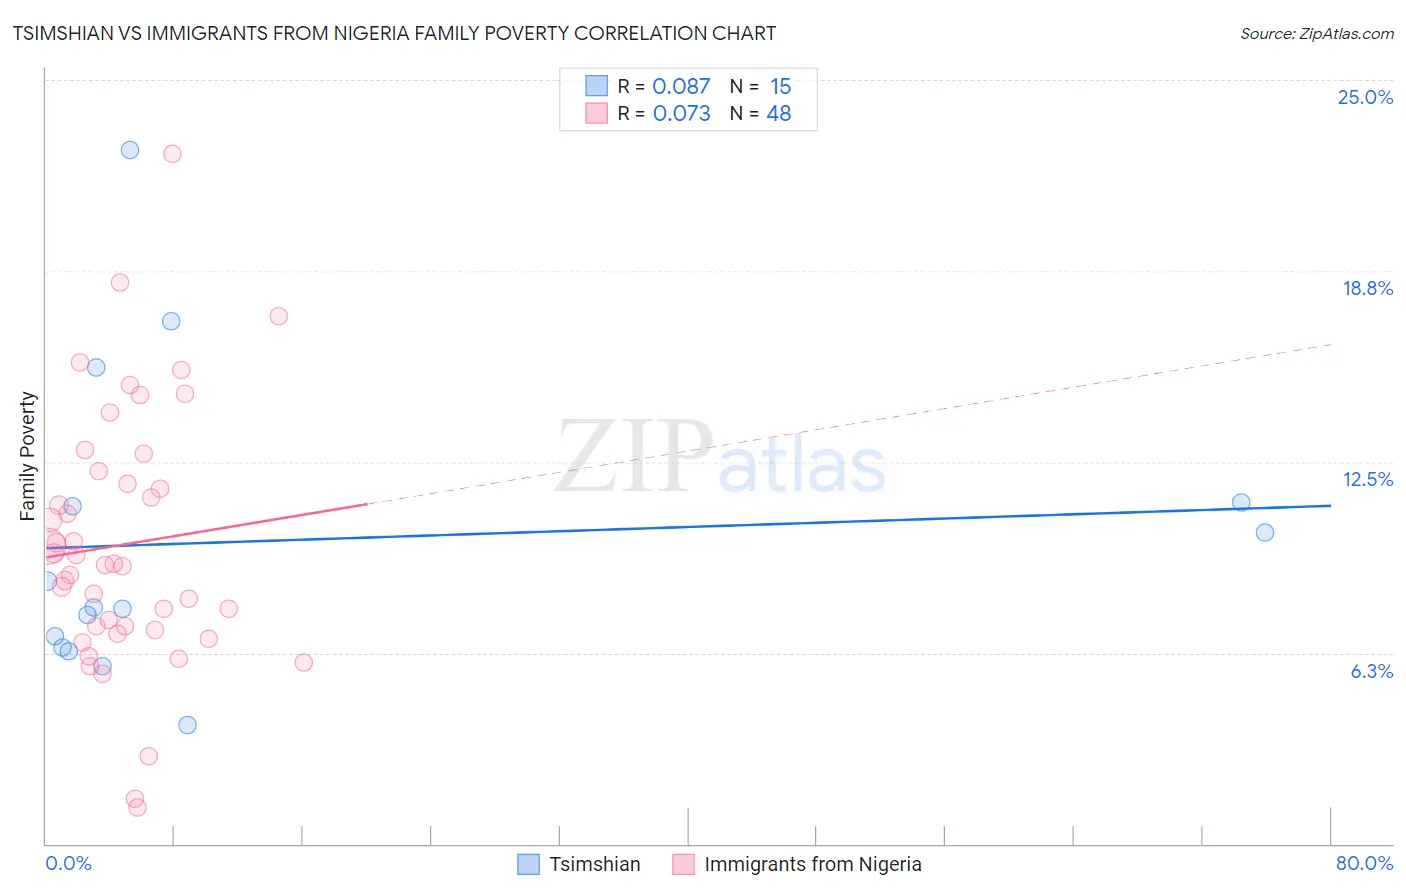
Tsimshian vs Immigrants from Nigeria Family Poverty Correlation Chart
The statistical analysis conducted on geographies consisting of 15,624,889 people shows a slight positive correlation between the proportion of Tsimshian and poverty level among families in the United States with a correlation coefficient (R) of 0.087 and weighted average of 8.8%. Similarly, the statistical analysis conducted on geographies consisting of 283,018,314 people shows a slight positive correlation between the proportion of Immigrants from Nigeria and poverty level among families in the United States with a correlation coefficient (R) of 0.073 and weighted average of 10.2%, a difference of 16.0%.
Family Poverty Correlation Summary
| Measurement | Tsimshian | Immigrants from Nigeria |
| Minimum | 3.9% | 1.2% |
| Maximum | 22.7% | 22.6% |
| Range | 18.9% | 21.4% |
| Mean | 9.9% | 9.8% |
| Median | 7.7% | 9.2% |
| Interquartile 25% (IQ1) | 6.4% | 7.1% |
| Interquartile 75% (IQ3) | 11.2% | 12.0% |
| Interquartile Range (IQR) | 4.7% | 4.9% |
| Standard Deviation (Sample) | 5.0% | 4.2% |
| Standard Deviation (Population) | 4.9% | 4.2% |
Similar Demographics by Family Poverty
Demographics Similar to Tsimshian by Family Poverty
In terms of family poverty, the demographic groups most similar to Tsimshian are White/Caucasian (8.8%, a difference of 0.040%), Peruvian (8.8%, a difference of 0.20%), Immigrants from Oceania (8.7%, a difference of 0.30%), Hungarian (8.8%, a difference of 0.34%), and Immigrants from Northern Africa (8.8%, a difference of 0.38%).
| Demographics | Rating | Rank | Family Poverty |
| Syrians | 80.3 /100 | #150 | Excellent 8.6% |
| Brazilians | 80.1 /100 | #151 | Excellent 8.6% |
| Samoans | 79.8 /100 | #152 | Good 8.6% |
| Immigrants | Spain | 79.1 /100 | #153 | Good 8.6% |
| Immigrants | Vietnam | 75.4 /100 | #154 | Good 8.7% |
| Immigrants | Kuwait | 73.6 /100 | #155 | Good 8.7% |
| Immigrants | Oceania | 71.2 /100 | #156 | Good 8.7% |
| Tsimshian | 69.3 /100 | #157 | Good 8.8% |
| Whites/Caucasians | 69.1 /100 | #158 | Good 8.8% |
| Peruvians | 68.0 /100 | #159 | Good 8.8% |
| Hungarians | 67.2 /100 | #160 | Good 8.8% |
| Immigrants | Northern Africa | 66.9 /100 | #161 | Good 8.8% |
| Ethiopians | 66.3 /100 | #162 | Good 8.8% |
| Pennsylvania Germans | 66.0 /100 | #163 | Good 8.8% |
| Celtics | 64.9 /100 | #164 | Good 8.8% |
Demographics Similar to Immigrants from Nigeria by Family Poverty
In terms of family poverty, the demographic groups most similar to Immigrants from Nigeria are Nigerian (10.1%, a difference of 0.25%), Immigrants from Laos (10.2%, a difference of 0.26%), Immigrants from Middle Africa (10.1%, a difference of 0.28%), Fijian (10.1%, a difference of 0.39%), and French American Indian (10.2%, a difference of 0.63%).
| Demographics | Rating | Rank | Family Poverty |
| Immigrants | Uzbekistan | 3.1 /100 | #229 | Tragic 10.0% |
| Immigrants | Panama | 3.1 /100 | #230 | Tragic 10.0% |
| Alaskan Athabascans | 2.7 /100 | #231 | Tragic 10.1% |
| Immigrants | Sudan | 2.3 /100 | #232 | Tragic 10.1% |
| Fijians | 2.1 /100 | #233 | Tragic 10.1% |
| Immigrants | Middle Africa | 2.1 /100 | #234 | Tragic 10.1% |
| Nigerians | 2.0 /100 | #235 | Tragic 10.1% |
| Immigrants | Nigeria | 1.9 /100 | #236 | Tragic 10.2% |
| Immigrants | Laos | 1.7 /100 | #237 | Tragic 10.2% |
| French American Indians | 1.5 /100 | #238 | Tragic 10.2% |
| Potawatomi | 1.5 /100 | #239 | Tragic 10.2% |
| Immigrants | Azores | 1.4 /100 | #240 | Tragic 10.3% |
| Ghanaians | 1.3 /100 | #241 | Tragic 10.3% |
| Alaska Natives | 1.0 /100 | #242 | Tragic 10.4% |
| Nepalese | 0.8 /100 | #243 | Tragic 10.4% |