Immigrants from Middle Africa vs Immigrants from Nigeria Female Disability
COMPARE
Immigrants from Middle Africa
Immigrants from Nigeria
Female Disability
Female Disability Comparison
Immigrants from Middle Africa
Immigrants from Nigeria
12.1%
FEMALE DISABILITY
72.4/ 100
METRIC RATING
158th/ 347
METRIC RANK
11.8%
FEMALE DISABILITY
97.2/ 100
METRIC RATING
118th/ 347
METRIC RANK
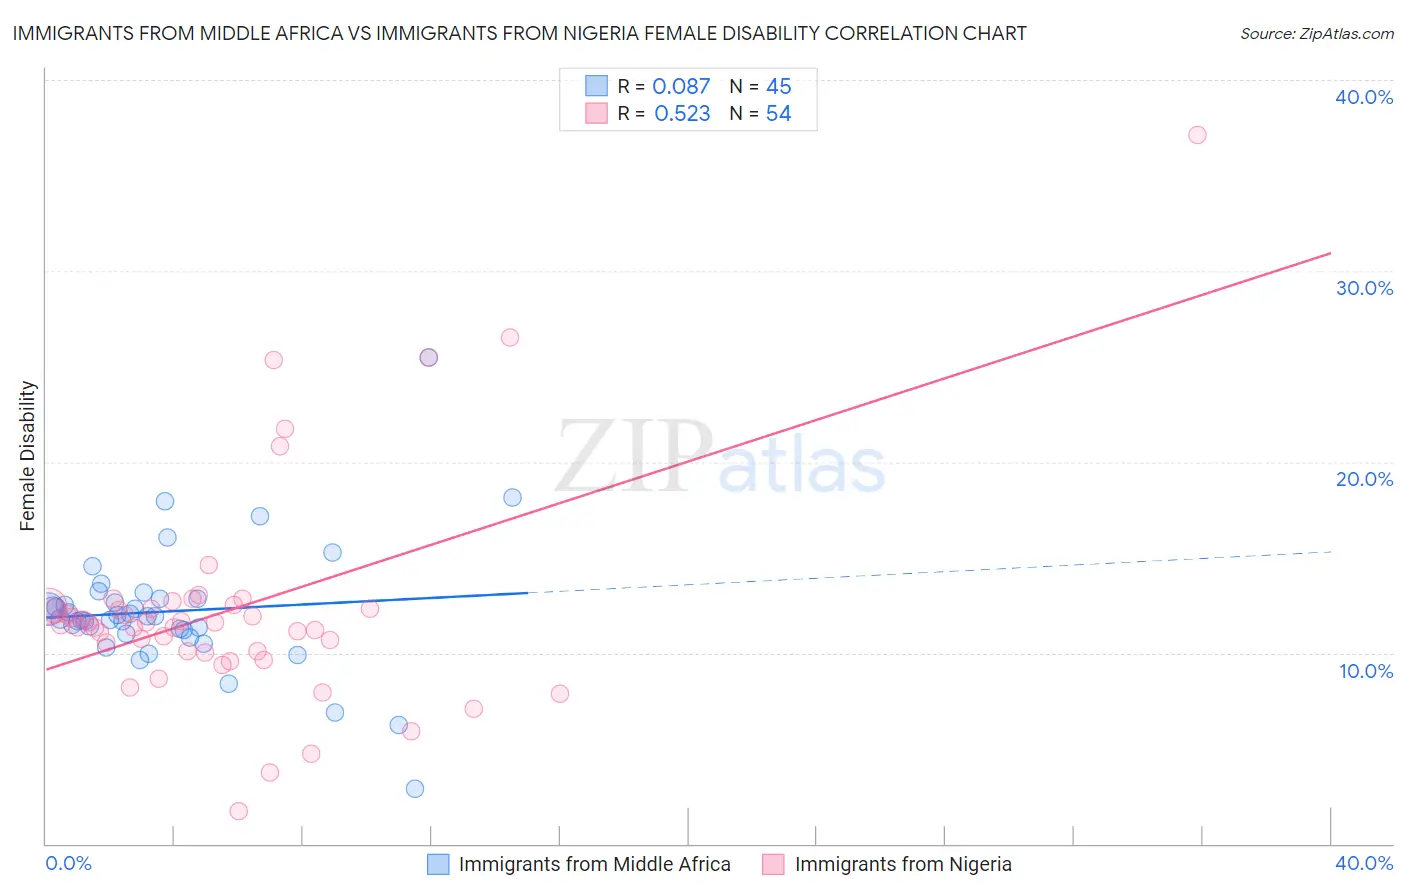
Immigrants from Middle Africa vs Immigrants from Nigeria Female Disability Correlation Chart
The statistical analysis conducted on geographies consisting of 202,716,278 people shows a slight positive correlation between the proportion of Immigrants from Middle Africa and percentage of females with a disability in the United States with a correlation coefficient (R) of 0.087 and weighted average of 12.1%. Similarly, the statistical analysis conducted on geographies consisting of 283,471,855 people shows a substantial positive correlation between the proportion of Immigrants from Nigeria and percentage of females with a disability in the United States with a correlation coefficient (R) of 0.523 and weighted average of 11.8%, a difference of 2.5%.
Female Disability Correlation Summary
| Measurement | Immigrants from Middle Africa | Immigrants from Nigeria |
| Minimum | 2.9% | 1.7% |
| Maximum | 25.5% | 37.1% |
| Range | 22.6% | 35.4% |
| Mean | 12.2% | 12.3% |
| Median | 11.9% | 11.5% |
| Interquartile 25% (IQ1) | 11.1% | 10.1% |
| Interquartile 75% (IQ3) | 12.8% | 12.4% |
| Interquartile Range (IQR) | 1.7% | 2.3% |
| Standard Deviation (Sample) | 3.4% | 5.8% |
| Standard Deviation (Population) | 3.3% | 5.7% |
Similar Demographics by Female Disability
Demographics Similar to Immigrants from Middle Africa by Female Disability
In terms of female disability, the demographic groups most similar to Immigrants from Middle Africa are Danish (12.1%, a difference of 0.010%), Moroccan (12.1%, a difference of 0.020%), Ghanaian (12.1%, a difference of 0.21%), Immigrants from Central America (12.1%, a difference of 0.21%), and Syrian (12.1%, a difference of 0.23%).
| Demographics | Rating | Rank | Female Disability |
| Icelanders | 80.7 /100 | #151 | Excellent 12.0% |
| Immigrants | Scotland | 79.3 /100 | #152 | Good 12.0% |
| Sudanese | 79.1 /100 | #153 | Good 12.0% |
| Syrians | 76.9 /100 | #154 | Good 12.1% |
| Ghanaians | 76.6 /100 | #155 | Good 12.1% |
| Moroccans | 72.9 /100 | #156 | Good 12.1% |
| Danes | 72.5 /100 | #157 | Good 12.1% |
| Immigrants | Middle Africa | 72.4 /100 | #158 | Good 12.1% |
| Immigrants | Central America | 67.7 /100 | #159 | Good 12.1% |
| Immigrants | Guatemala | 66.0 /100 | #160 | Good 12.1% |
| Guyanese | 64.7 /100 | #161 | Good 12.1% |
| Immigrants | Ukraine | 64.3 /100 | #162 | Good 12.1% |
| Guatemalans | 63.8 /100 | #163 | Good 12.1% |
| Czechs | 63.6 /100 | #164 | Good 12.1% |
| Immigrants | Oceania | 61.8 /100 | #165 | Good 12.1% |
Demographics Similar to Immigrants from Nigeria by Female Disability
In terms of female disability, the demographic groups most similar to Immigrants from Nigeria are Immigrants from Eastern Europe (11.8%, a difference of 0.0%), Immigrants from Uganda (11.8%, a difference of 0.010%), Immigrants from Kazakhstan (11.8%, a difference of 0.090%), Immigrants from Netherlands (11.8%, a difference of 0.11%), and Immigrants from North Macedonia (11.8%, a difference of 0.12%).
| Demographics | Rating | Rank | Female Disability |
| Costa Ricans | 98.1 /100 | #111 | Exceptional 11.7% |
| Immigrants | Bangladesh | 97.8 /100 | #112 | Exceptional 11.8% |
| Immigrants | Belarus | 97.8 /100 | #113 | Exceptional 11.8% |
| South Africans | 97.7 /100 | #114 | Exceptional 11.8% |
| Brazilians | 97.7 /100 | #115 | Exceptional 11.8% |
| Immigrants | Morocco | 97.6 /100 | #116 | Exceptional 11.8% |
| Immigrants | Eastern Europe | 97.2 /100 | #117 | Exceptional 11.8% |
| Immigrants | Nigeria | 97.2 /100 | #118 | Exceptional 11.8% |
| Immigrants | Uganda | 97.2 /100 | #119 | Exceptional 11.8% |
| Immigrants | Kazakhstan | 97.0 /100 | #120 | Exceptional 11.8% |
| Immigrants | Netherlands | 96.9 /100 | #121 | Exceptional 11.8% |
| Immigrants | North Macedonia | 96.8 /100 | #122 | Exceptional 11.8% |
| Immigrants | Croatia | 96.7 /100 | #123 | Exceptional 11.8% |
| Russians | 96.5 /100 | #124 | Exceptional 11.8% |
| Immigrants | Italy | 96.4 /100 | #125 | Exceptional 11.8% |