Spanish American vs Subsaharan African Male Disability
COMPARE
Spanish American
Subsaharan African
Male Disability
Male Disability Comparison
Spanish Americans
Sub-Saharan Africans
13.3%
MALE DISABILITY
0.0/ 100
METRIC RATING
306th/ 347
METRIC RANK
11.8%
MALE DISABILITY
2.8/ 100
METRIC RATING
226th/ 347
METRIC RANK
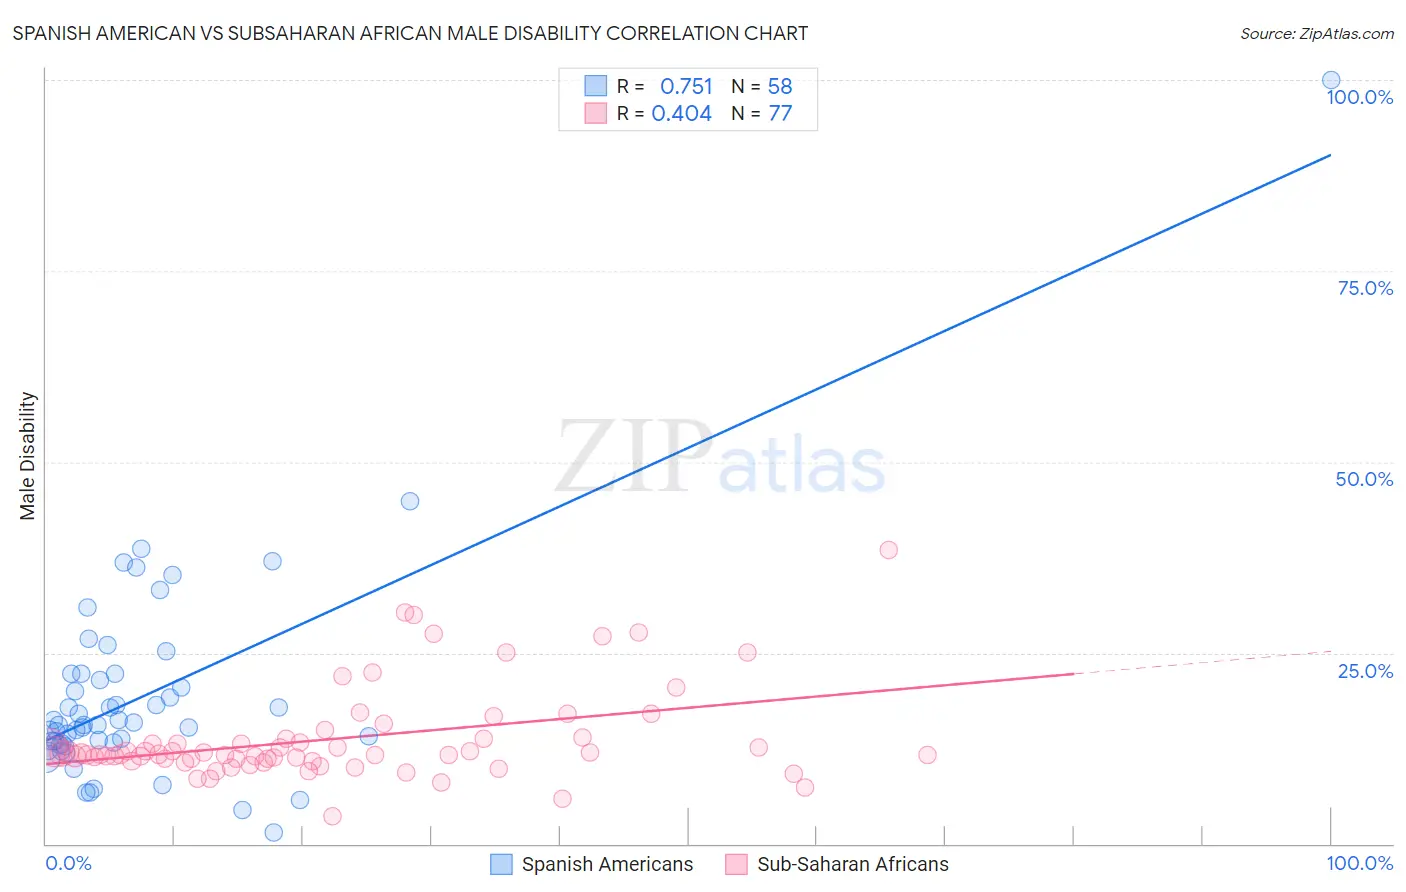
Spanish American vs Subsaharan African Male Disability Correlation Chart
The statistical analysis conducted on geographies consisting of 103,168,245 people shows a strong positive correlation between the proportion of Spanish Americans and percentage of males with a disability in the United States with a correlation coefficient (R) of 0.751 and weighted average of 13.3%. Similarly, the statistical analysis conducted on geographies consisting of 508,010,863 people shows a moderate positive correlation between the proportion of Sub-Saharan Africans and percentage of males with a disability in the United States with a correlation coefficient (R) of 0.404 and weighted average of 11.8%, a difference of 13.2%.
Male Disability Correlation Summary
| Measurement | Spanish American | Subsaharan African |
| Minimum | 1.4% | 3.6% |
| Maximum | 100.0% | 38.5% |
| Range | 98.6% | 34.8% |
| Mean | 19.4% | 13.8% |
| Median | 15.6% | 11.7% |
| Interquartile 25% (IQ1) | 13.1% | 11.0% |
| Interquartile 75% (IQ3) | 22.2% | 13.7% |
| Interquartile Range (IQR) | 9.0% | 2.8% |
| Standard Deviation (Sample) | 14.1% | 6.1% |
| Standard Deviation (Population) | 14.0% | 6.0% |
Similar Demographics by Male Disability
Demographics Similar to Spanish Americans by Male Disability
In terms of male disability, the demographic groups most similar to Spanish Americans are French Canadian (13.3%, a difference of 0.20%), Arapaho (13.3%, a difference of 0.22%), French American Indian (13.4%, a difference of 0.38%), Black/African American (13.2%, a difference of 0.61%), and Blackfeet (13.4%, a difference of 0.80%).
| Demographics | Rating | Rank | Male Disability |
| Celtics | 0.0 /100 | #299 | Tragic 13.0% |
| Cheyenne | 0.0 /100 | #300 | Tragic 13.0% |
| French | 0.0 /100 | #301 | Tragic 13.0% |
| Crow | 0.0 /100 | #302 | Tragic 13.1% |
| Scotch-Irish | 0.0 /100 | #303 | Tragic 13.2% |
| Blacks/African Americans | 0.0 /100 | #304 | Tragic 13.2% |
| French Canadians | 0.0 /100 | #305 | Tragic 13.3% |
| Spanish Americans | 0.0 /100 | #306 | Tragic 13.3% |
| Arapaho | 0.0 /100 | #307 | Tragic 13.3% |
| French American Indians | 0.0 /100 | #308 | Tragic 13.4% |
| Blackfeet | 0.0 /100 | #309 | Tragic 13.4% |
| Immigrants | Azores | 0.0 /100 | #310 | Tragic 13.4% |
| Delaware | 0.0 /100 | #311 | Tragic 13.5% |
| Yakama | 0.0 /100 | #312 | Tragic 13.5% |
| Puget Sound Salish | 0.0 /100 | #313 | Tragic 13.5% |
Demographics Similar to Sub-Saharan Africans by Male Disability
In terms of male disability, the demographic groups most similar to Sub-Saharan Africans are Liberian (11.8%, a difference of 0.12%), Japanese (11.7%, a difference of 0.13%), Immigrants from Bahamas (11.7%, a difference of 0.15%), Austrian (11.8%, a difference of 0.18%), and Alsatian (11.7%, a difference of 0.24%).
| Demographics | Rating | Rank | Male Disability |
| Panamanians | 3.8 /100 | #219 | Tragic 11.7% |
| Immigrants | Western Europe | 3.8 /100 | #220 | Tragic 11.7% |
| Immigrants | Congo | 3.7 /100 | #221 | Tragic 11.7% |
| Alsatians | 3.3 /100 | #222 | Tragic 11.7% |
| Immigrants | Bahamas | 3.2 /100 | #223 | Tragic 11.7% |
| Japanese | 3.1 /100 | #224 | Tragic 11.7% |
| Liberians | 3.1 /100 | #225 | Tragic 11.8% |
| Sub-Saharan Africans | 2.8 /100 | #226 | Tragic 11.8% |
| Austrians | 2.5 /100 | #227 | Tragic 11.8% |
| Hispanics or Latinos | 2.3 /100 | #228 | Tragic 11.8% |
| Bermudans | 2.3 /100 | #229 | Tragic 11.8% |
| Croatians | 2.1 /100 | #230 | Tragic 11.8% |
| Dominicans | 1.8 /100 | #231 | Tragic 11.8% |
| Malaysians | 1.8 /100 | #232 | Tragic 11.8% |
| Mexicans | 1.7 /100 | #233 | Tragic 11.8% |