Spanish American vs Kiowa Male Disability
COMPARE
Spanish American
Kiowa
Male Disability
Male Disability Comparison
Spanish Americans
Kiowa
13.3%
MALE DISABILITY
0.0/ 100
METRIC RATING
306th/ 347
METRIC RANK
15.4%
MALE DISABILITY
0.0/ 100
METRIC RATING
342nd/ 347
METRIC RANK
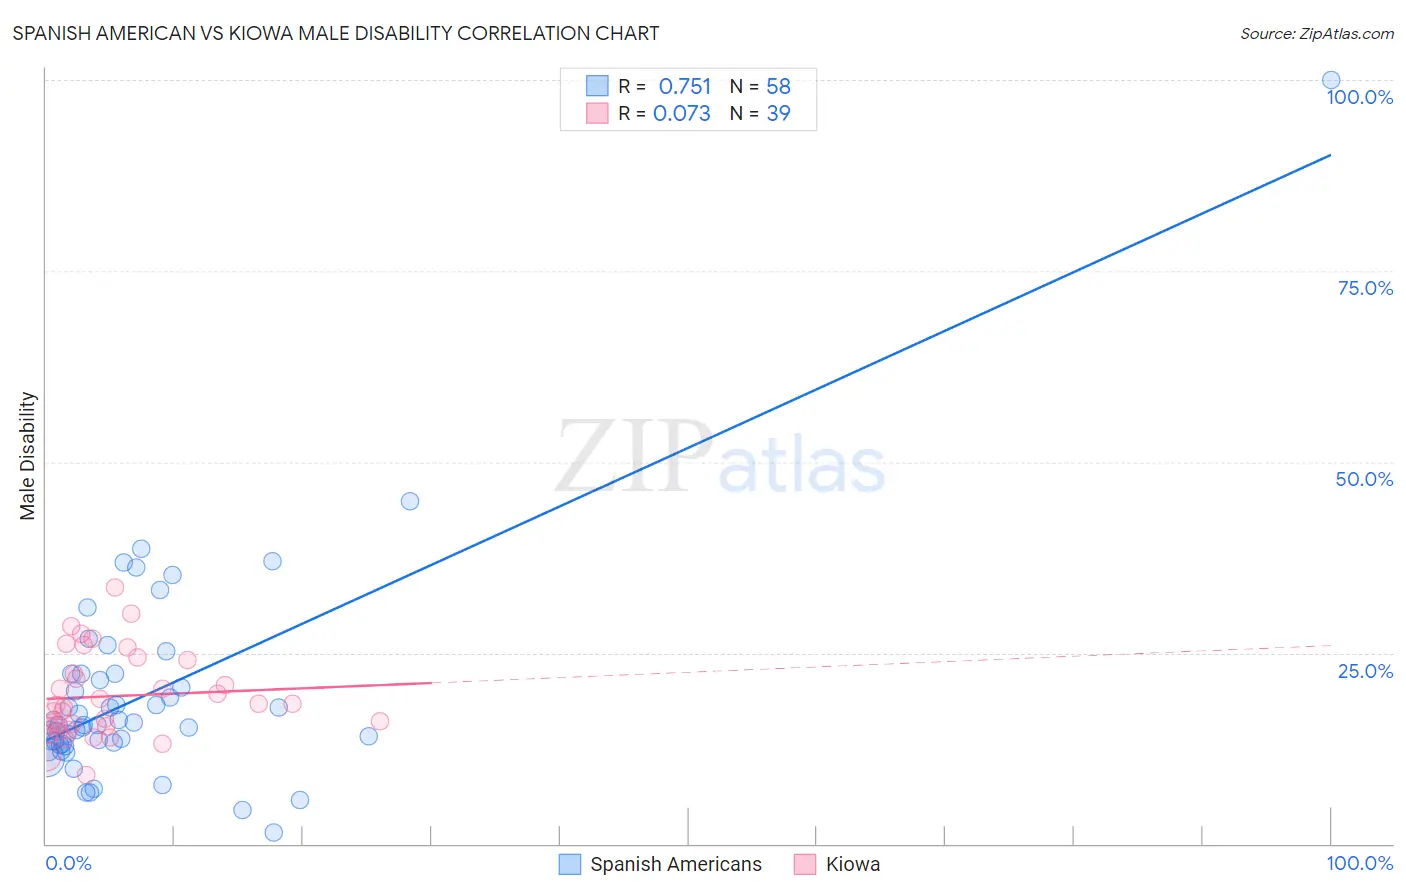
Spanish American vs Kiowa Male Disability Correlation Chart
The statistical analysis conducted on geographies consisting of 103,168,245 people shows a strong positive correlation between the proportion of Spanish Americans and percentage of males with a disability in the United States with a correlation coefficient (R) of 0.751 and weighted average of 13.3%. Similarly, the statistical analysis conducted on geographies consisting of 56,098,760 people shows a slight positive correlation between the proportion of Kiowa and percentage of males with a disability in the United States with a correlation coefficient (R) of 0.073 and weighted average of 15.4%, a difference of 15.9%.
Male Disability Correlation Summary
| Measurement | Spanish American | Kiowa |
| Minimum | 1.4% | 9.0% |
| Maximum | 100.0% | 33.5% |
| Range | 98.6% | 24.5% |
| Mean | 19.4% | 19.3% |
| Median | 15.6% | 18.2% |
| Interquartile 25% (IQ1) | 13.1% | 15.3% |
| Interquartile 75% (IQ3) | 22.2% | 24.1% |
| Interquartile Range (IQR) | 9.0% | 8.8% |
| Standard Deviation (Sample) | 14.1% | 5.6% |
| Standard Deviation (Population) | 14.0% | 5.5% |
Similar Demographics by Male Disability
Demographics Similar to Spanish Americans by Male Disability
In terms of male disability, the demographic groups most similar to Spanish Americans are French Canadian (13.3%, a difference of 0.20%), Arapaho (13.3%, a difference of 0.22%), French American Indian (13.4%, a difference of 0.38%), Black/African American (13.2%, a difference of 0.61%), and Blackfeet (13.4%, a difference of 0.80%).
| Demographics | Rating | Rank | Male Disability |
| Celtics | 0.0 /100 | #299 | Tragic 13.0% |
| Cheyenne | 0.0 /100 | #300 | Tragic 13.0% |
| French | 0.0 /100 | #301 | Tragic 13.0% |
| Crow | 0.0 /100 | #302 | Tragic 13.1% |
| Scotch-Irish | 0.0 /100 | #303 | Tragic 13.2% |
| Blacks/African Americans | 0.0 /100 | #304 | Tragic 13.2% |
| French Canadians | 0.0 /100 | #305 | Tragic 13.3% |
| Spanish Americans | 0.0 /100 | #306 | Tragic 13.3% |
| Arapaho | 0.0 /100 | #307 | Tragic 13.3% |
| French American Indians | 0.0 /100 | #308 | Tragic 13.4% |
| Blackfeet | 0.0 /100 | #309 | Tragic 13.4% |
| Immigrants | Azores | 0.0 /100 | #310 | Tragic 13.4% |
| Delaware | 0.0 /100 | #311 | Tragic 13.5% |
| Yakama | 0.0 /100 | #312 | Tragic 13.5% |
| Puget Sound Salish | 0.0 /100 | #313 | Tragic 13.5% |
Demographics Similar to Kiowa by Male Disability
In terms of male disability, the demographic groups most similar to Kiowa are Choctaw (15.4%, a difference of 0.19%), Creek (15.5%, a difference of 0.66%), Puerto Rican (15.6%, a difference of 0.79%), Tsimshian (15.6%, a difference of 1.1%), and Lumbee (15.2%, a difference of 1.3%).
| Demographics | Rating | Rank | Male Disability |
| Yuman | 0.0 /100 | #333 | Tragic 14.7% |
| Cherokee | 0.0 /100 | #334 | Tragic 14.8% |
| Dutch West Indians | 0.0 /100 | #335 | Tragic 14.8% |
| Alaskan Athabascans | 0.0 /100 | #336 | Tragic 14.9% |
| Menominee | 0.0 /100 | #337 | Tragic 15.0% |
| Pueblo | 0.0 /100 | #338 | Tragic 15.0% |
| Chickasaw | 0.0 /100 | #339 | Tragic 15.1% |
| Lumbee | 0.0 /100 | #340 | Tragic 15.2% |
| Choctaw | 0.0 /100 | #341 | Tragic 15.4% |
| Kiowa | 0.0 /100 | #342 | Tragic 15.4% |
| Creek | 0.0 /100 | #343 | Tragic 15.5% |
| Puerto Ricans | 0.0 /100 | #344 | Tragic 15.6% |
| Tsimshian | 0.0 /100 | #345 | Tragic 15.6% |
| Colville | 0.0 /100 | #346 | Tragic 16.5% |
| Houma | 0.0 /100 | #347 | Tragic 17.4% |