Sioux vs Black/African American Male Disability
COMPARE
Sioux
Black/African American
Male Disability
Male Disability Comparison
Sioux
Blacks/African Americans
12.7%
MALE DISABILITY
0.0/ 100
METRIC RATING
281st/ 347
METRIC RANK
13.2%
MALE DISABILITY
0.0/ 100
METRIC RATING
304th/ 347
METRIC RANK
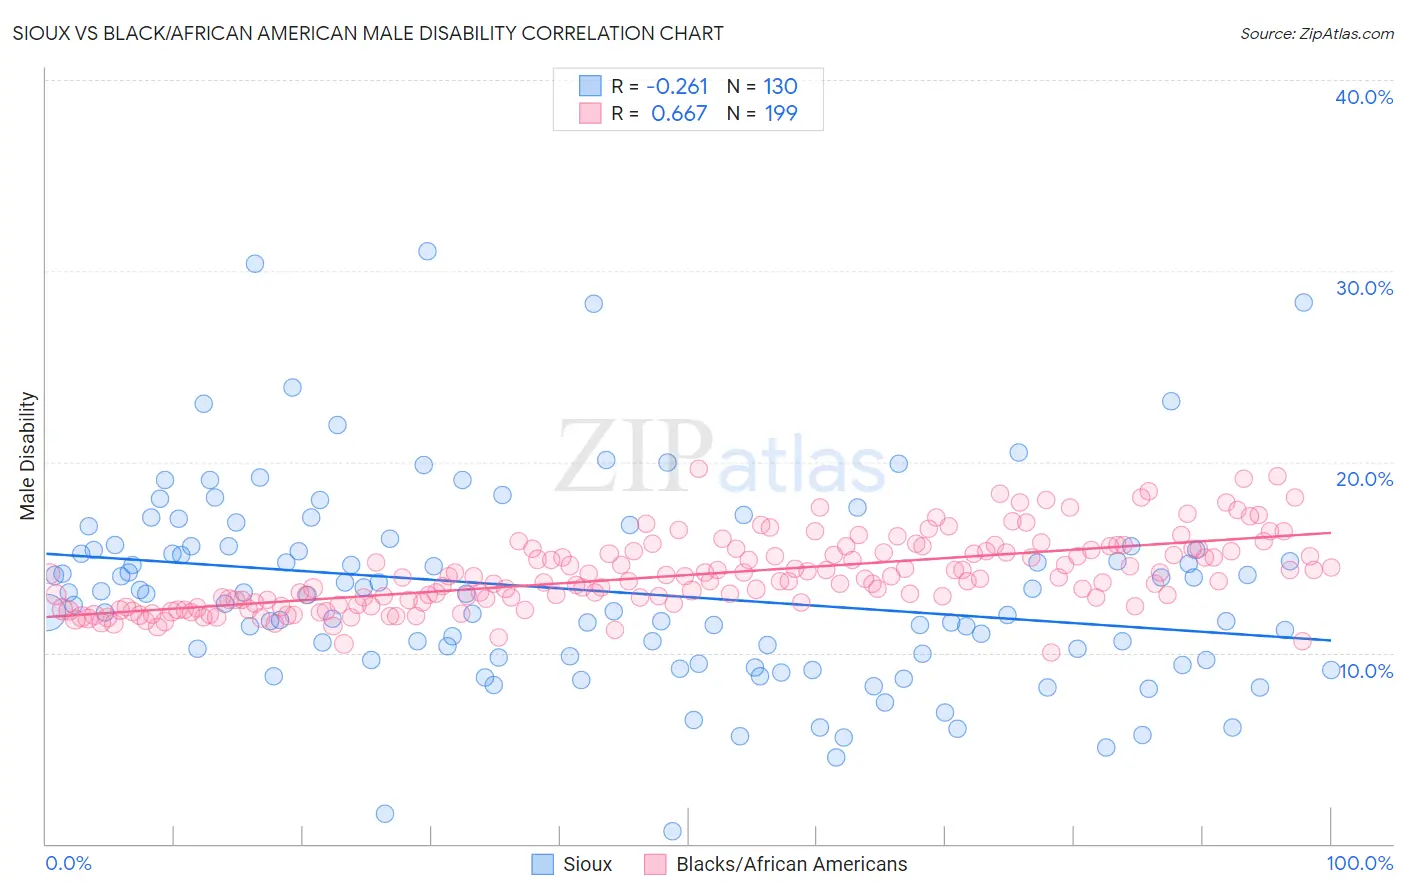
Sioux vs Black/African American Male Disability Correlation Chart
The statistical analysis conducted on geographies consisting of 234,137,085 people shows a weak negative correlation between the proportion of Sioux and percentage of males with a disability in the United States with a correlation coefficient (R) of -0.261 and weighted average of 12.7%. Similarly, the statistical analysis conducted on geographies consisting of 565,716,531 people shows a significant positive correlation between the proportion of Blacks/African Americans and percentage of males with a disability in the United States with a correlation coefficient (R) of 0.667 and weighted average of 13.2%, a difference of 4.1%.
Male Disability Correlation Summary
| Measurement | Sioux | Black/African American |
| Minimum | 0.66% | 10.0% |
| Maximum | 31.1% | 19.6% |
| Range | 30.4% | 9.6% |
| Mean | 13.2% | 14.1% |
| Median | 13.1% | 13.7% |
| Interquartile 25% (IQ1) | 9.8% | 12.6% |
| Interquartile 75% (IQ3) | 15.6% | 15.3% |
| Interquartile Range (IQR) | 5.8% | 2.7% |
| Standard Deviation (Sample) | 5.2% | 1.9% |
| Standard Deviation (Population) | 5.2% | 1.9% |
Similar Demographics by Male Disability
Demographics Similar to Sioux by Male Disability
In terms of male disability, the demographic groups most similar to Sioux are Dutch (12.7%, a difference of 0.060%), Irish (12.7%, a difference of 0.060%), German (12.7%, a difference of 0.070%), Slovak (12.7%, a difference of 0.11%), and Central American Indian (12.7%, a difference of 0.26%).
| Demographics | Rating | Rank | Male Disability |
| Hopi | 0.0 /100 | #274 | Tragic 12.5% |
| Fijians | 0.0 /100 | #275 | Tragic 12.6% |
| Africans | 0.0 /100 | #276 | Tragic 12.6% |
| Finns | 0.0 /100 | #277 | Tragic 12.6% |
| Central American Indians | 0.0 /100 | #278 | Tragic 12.7% |
| Slovaks | 0.0 /100 | #279 | Tragic 12.7% |
| Dutch | 0.0 /100 | #280 | Tragic 12.7% |
| Sioux | 0.0 /100 | #281 | Tragic 12.7% |
| Irish | 0.0 /100 | #282 | Tragic 12.7% |
| Germans | 0.0 /100 | #283 | Tragic 12.7% |
| Spanish | 0.0 /100 | #284 | Tragic 12.7% |
| Welsh | 0.0 /100 | #285 | Tragic 12.7% |
| Scottish | 0.0 /100 | #286 | Tragic 12.8% |
| Cape Verdeans | 0.0 /100 | #287 | Tragic 12.8% |
| Yup'ik | 0.0 /100 | #288 | Tragic 12.8% |
Demographics Similar to Blacks/African Americans by Male Disability
In terms of male disability, the demographic groups most similar to Blacks/African Americans are Scotch-Irish (13.2%, a difference of 0.32%), French Canadian (13.3%, a difference of 0.41%), Spanish American (13.3%, a difference of 0.61%), Arapaho (13.3%, a difference of 0.84%), and Crow (13.1%, a difference of 0.87%).
| Demographics | Rating | Rank | Male Disability |
| Inupiat | 0.0 /100 | #297 | Tragic 13.0% |
| Pennsylvania Germans | 0.0 /100 | #298 | Tragic 13.0% |
| Celtics | 0.0 /100 | #299 | Tragic 13.0% |
| Cheyenne | 0.0 /100 | #300 | Tragic 13.0% |
| French | 0.0 /100 | #301 | Tragic 13.0% |
| Crow | 0.0 /100 | #302 | Tragic 13.1% |
| Scotch-Irish | 0.0 /100 | #303 | Tragic 13.2% |
| Blacks/African Americans | 0.0 /100 | #304 | Tragic 13.2% |
| French Canadians | 0.0 /100 | #305 | Tragic 13.3% |
| Spanish Americans | 0.0 /100 | #306 | Tragic 13.3% |
| Arapaho | 0.0 /100 | #307 | Tragic 13.3% |
| French American Indians | 0.0 /100 | #308 | Tragic 13.4% |
| Blackfeet | 0.0 /100 | #309 | Tragic 13.4% |
| Immigrants | Azores | 0.0 /100 | #310 | Tragic 13.4% |
| Delaware | 0.0 /100 | #311 | Tragic 13.5% |