Sioux vs Immigrants from Eastern Asia Male Disability
COMPARE
Sioux
Immigrants from Eastern Asia
Male Disability
Male Disability Comparison
Sioux
Immigrants from Eastern Asia
12.7%
MALE DISABILITY
0.0/ 100
METRIC RATING
281st/ 347
METRIC RANK
9.6%
MALE DISABILITY
100.0/ 100
METRIC RATING
11th/ 347
METRIC RANK
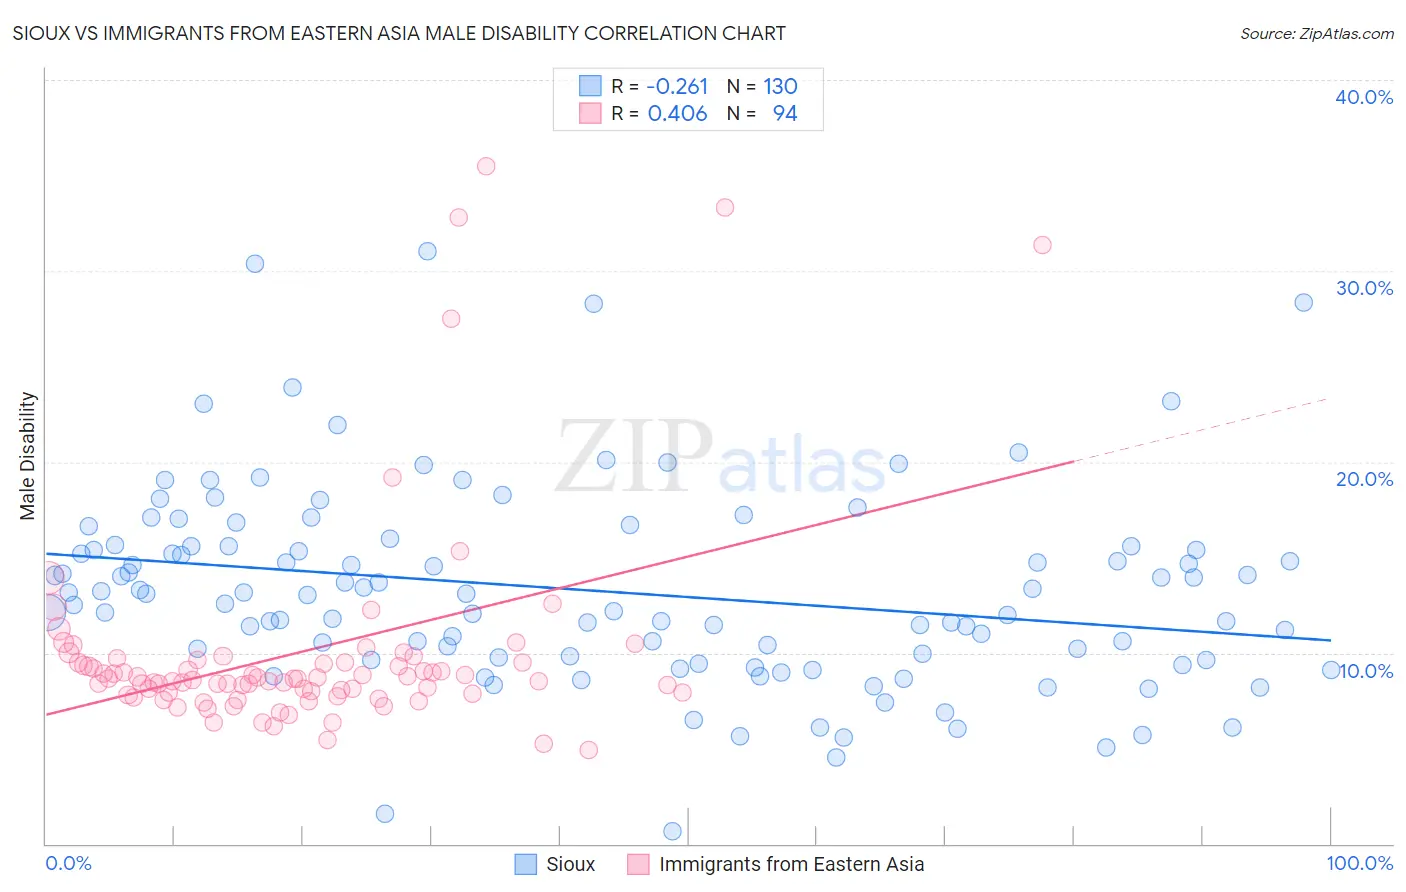
Sioux vs Immigrants from Eastern Asia Male Disability Correlation Chart
The statistical analysis conducted on geographies consisting of 234,137,085 people shows a weak negative correlation between the proportion of Sioux and percentage of males with a disability in the United States with a correlation coefficient (R) of -0.261 and weighted average of 12.7%. Similarly, the statistical analysis conducted on geographies consisting of 499,820,999 people shows a moderate positive correlation between the proportion of Immigrants from Eastern Asia and percentage of males with a disability in the United States with a correlation coefficient (R) of 0.406 and weighted average of 9.6%, a difference of 32.1%.
Male Disability Correlation Summary
| Measurement | Sioux | Immigrants from Eastern Asia |
| Minimum | 0.66% | 4.9% |
| Maximum | 31.1% | 35.5% |
| Range | 30.4% | 30.6% |
| Mean | 13.2% | 10.0% |
| Median | 13.1% | 8.7% |
| Interquartile 25% (IQ1) | 9.8% | 7.9% |
| Interquartile 75% (IQ3) | 15.6% | 9.5% |
| Interquartile Range (IQR) | 5.8% | 1.6% |
| Standard Deviation (Sample) | 5.2% | 5.6% |
| Standard Deviation (Population) | 5.2% | 5.6% |
Similar Demographics by Male Disability
Demographics Similar to Sioux by Male Disability
In terms of male disability, the demographic groups most similar to Sioux are Dutch (12.7%, a difference of 0.060%), Irish (12.7%, a difference of 0.060%), German (12.7%, a difference of 0.070%), Slovak (12.7%, a difference of 0.11%), and Central American Indian (12.7%, a difference of 0.26%).
| Demographics | Rating | Rank | Male Disability |
| Hopi | 0.0 /100 | #274 | Tragic 12.5% |
| Fijians | 0.0 /100 | #275 | Tragic 12.6% |
| Africans | 0.0 /100 | #276 | Tragic 12.6% |
| Finns | 0.0 /100 | #277 | Tragic 12.6% |
| Central American Indians | 0.0 /100 | #278 | Tragic 12.7% |
| Slovaks | 0.0 /100 | #279 | Tragic 12.7% |
| Dutch | 0.0 /100 | #280 | Tragic 12.7% |
| Sioux | 0.0 /100 | #281 | Tragic 12.7% |
| Irish | 0.0 /100 | #282 | Tragic 12.7% |
| Germans | 0.0 /100 | #283 | Tragic 12.7% |
| Spanish | 0.0 /100 | #284 | Tragic 12.7% |
| Welsh | 0.0 /100 | #285 | Tragic 12.7% |
| Scottish | 0.0 /100 | #286 | Tragic 12.8% |
| Cape Verdeans | 0.0 /100 | #287 | Tragic 12.8% |
| Yup'ik | 0.0 /100 | #288 | Tragic 12.8% |
Demographics Similar to Immigrants from Eastern Asia by Male Disability
In terms of male disability, the demographic groups most similar to Immigrants from Eastern Asia are Bolivian (9.6%, a difference of 0.24%), Iranian (9.7%, a difference of 0.46%), Immigrants from Israel (9.6%, a difference of 0.55%), Immigrants from Iran (9.7%, a difference of 0.56%), and Immigrants from Singapore (9.5%, a difference of 0.98%).
| Demographics | Rating | Rank | Male Disability |
| Thais | 100.0 /100 | #4 | Exceptional 9.2% |
| Immigrants | Hong Kong | 100.0 /100 | #5 | Exceptional 9.4% |
| Immigrants | South Central Asia | 100.0 /100 | #6 | Exceptional 9.4% |
| Immigrants | Bolivia | 100.0 /100 | #7 | Exceptional 9.5% |
| Immigrants | China | 100.0 /100 | #8 | Exceptional 9.5% |
| Immigrants | Singapore | 100.0 /100 | #9 | Exceptional 9.5% |
| Immigrants | Israel | 100.0 /100 | #10 | Exceptional 9.6% |
| Immigrants | Eastern Asia | 100.0 /100 | #11 | Exceptional 9.6% |
| Bolivians | 100.0 /100 | #12 | Exceptional 9.6% |
| Iranians | 100.0 /100 | #13 | Exceptional 9.7% |
| Immigrants | Iran | 100.0 /100 | #14 | Exceptional 9.7% |
| Indians (Asian) | 100.0 /100 | #15 | Exceptional 9.7% |
| Okinawans | 100.0 /100 | #16 | Exceptional 9.8% |
| Immigrants | Korea | 100.0 /100 | #17 | Exceptional 9.8% |
| Immigrants | Pakistan | 100.0 /100 | #18 | Exceptional 9.8% |