Portland, CT Map & Demographics
Portland Map
Portland Overview
$44,122
PER CAPITA INCOME
$135,427
AVG FAMILY INCOME
$94,923
AVG HOUSEHOLD INCOME
27.3%
WAGE / INCOME GAP [ % ]
72.7¢/ $1
WAGE / INCOME GAP [ $ ]
0.39
INEQUALITY / GINI INDEX
6,417
TOTAL POPULATION
3,238
MALE POPULATION
3,179
FEMALE POPULATION
101.86
MALES / 100 FEMALES
98.18
FEMALES / 100 MALES
38.9
MEDIAN AGE
3.0
AVG FAMILY SIZE
2.5
AVG HOUSEHOLD SIZE
3,770
LABOR FORCE [ PEOPLE ]
72.9%
PERCENT IN LABOR FORCE
6.3%
UNEMPLOYMENT RATE
Portland Zip Codes
Portland Area Codes
Income in Portland
Income Overview in Portland
Per Capita Income in Portland is $44,122, while median incomes of families and households are $135,427 and $94,923 respectively.
| Characteristic | Number | Measure |
| Per Capita Income | 6,417 | $44,122 |
| Median Family Income | 1,704 | $135,427 |
| Mean Family Income | 1,704 | $138,405 |
| Median Household Income | 2,502 | $94,923 |
| Mean Household Income | 2,502 | $111,929 |
| Income Deficit | 1,704 | $0 |
| Wage / Income Gap (%) | 6,417 | 27.28% |
| Wage / Income Gap ($) | 6,417 | 72.72¢ per $1 |
| Gini / Inequality Index | 6,417 | 0.39 |
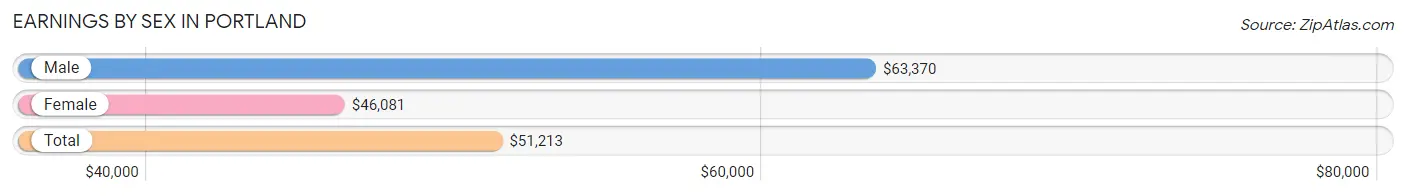
Earnings by Sex in Portland
Average Earnings in Portland are $51,213, $63,370 for men and $46,081 for women, a difference of 27.3%.
| Sex | Number | Average Earnings |
| Male | 2,048 (53.6%) | $63,370 |
| Female | 1,776 (46.4%) | $46,081 |
| Total | 3,824 (100.0%) | $51,213 |
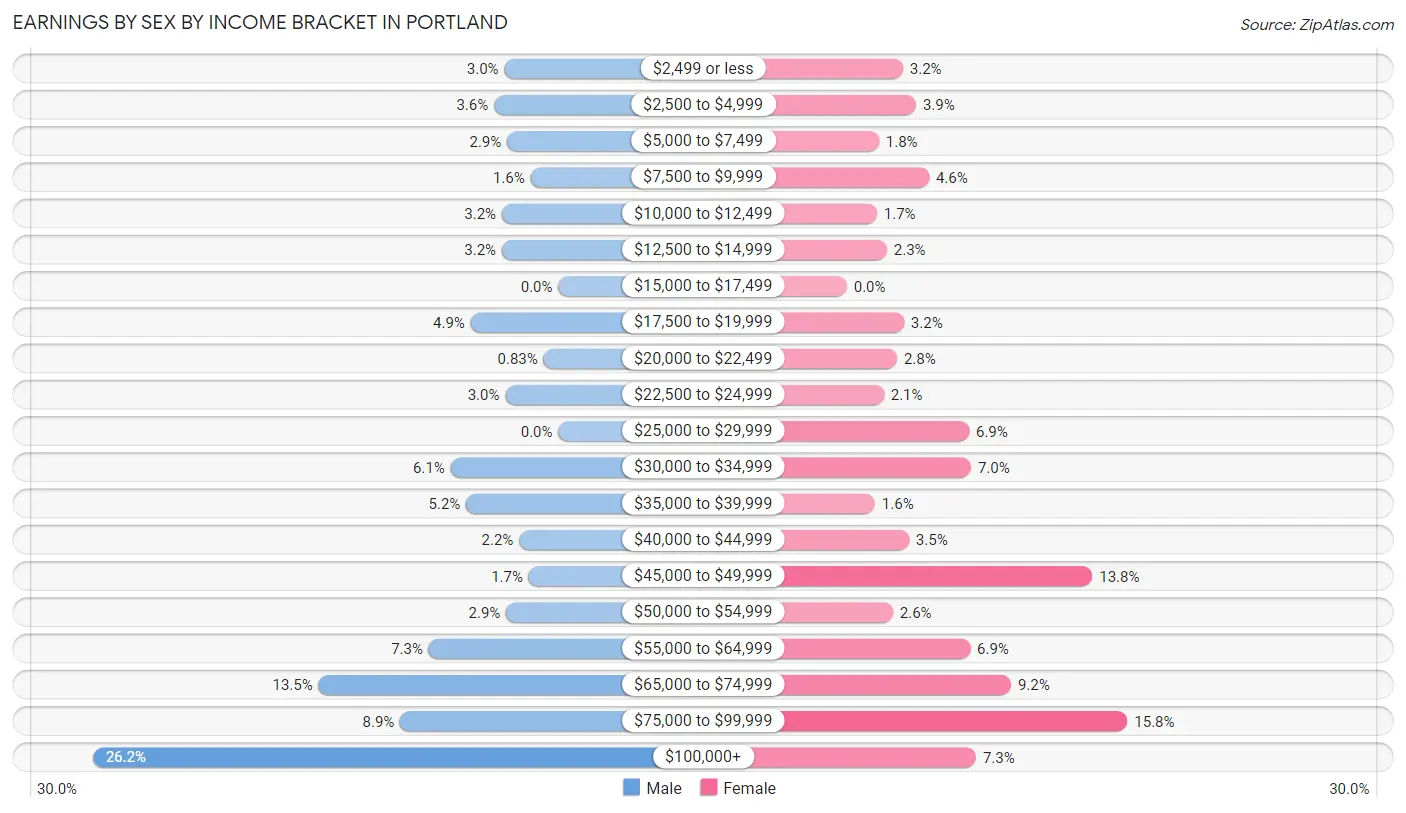
Earnings by Sex by Income Bracket in Portland
The most common earnings brackets in Portland are $100,000+ for men (536 | 26.2%) and $75,000 to $99,999 for women (280 | 15.8%).
| Income | Male | Female |
| $2,499 or less | 62 (3.0%) | 56 (3.2%) |
| $2,500 to $4,999 | 74 (3.6%) | 69 (3.9%) |
| $5,000 to $7,499 | 59 (2.9%) | 32 (1.8%) |
| $7,500 to $9,999 | 32 (1.6%) | 82 (4.6%) |
| $10,000 to $12,499 | 65 (3.2%) | 30 (1.7%) |
| $12,500 to $14,999 | 65 (3.2%) | 40 (2.2%) |
| $15,000 to $17,499 | 0 (0.0%) | 0 (0.0%) |
| $17,500 to $19,999 | 101 (4.9%) | 57 (3.2%) |
| $20,000 to $22,499 | 17 (0.8%) | 50 (2.8%) |
| $22,500 to $24,999 | 61 (3.0%) | 37 (2.1%) |
| $25,000 to $29,999 | 0 (0.0%) | 122 (6.9%) |
| $30,000 to $34,999 | 124 (6.0%) | 124 (7.0%) |
| $35,000 to $39,999 | 106 (5.2%) | 28 (1.6%) |
| $40,000 to $44,999 | 45 (2.2%) | 62 (3.5%) |
| $45,000 to $49,999 | 34 (1.7%) | 245 (13.8%) |
| $50,000 to $54,999 | 60 (2.9%) | 46 (2.6%) |
| $55,000 to $64,999 | 149 (7.3%) | 123 (6.9%) |
| $65,000 to $74,999 | 276 (13.5%) | 164 (9.2%) |
| $75,000 to $99,999 | 182 (8.9%) | 280 (15.8%) |
| $100,000+ | 536 (26.2%) | 129 (7.3%) |
| Total | 2,048 (100.0%) | 1,776 (100.0%) |
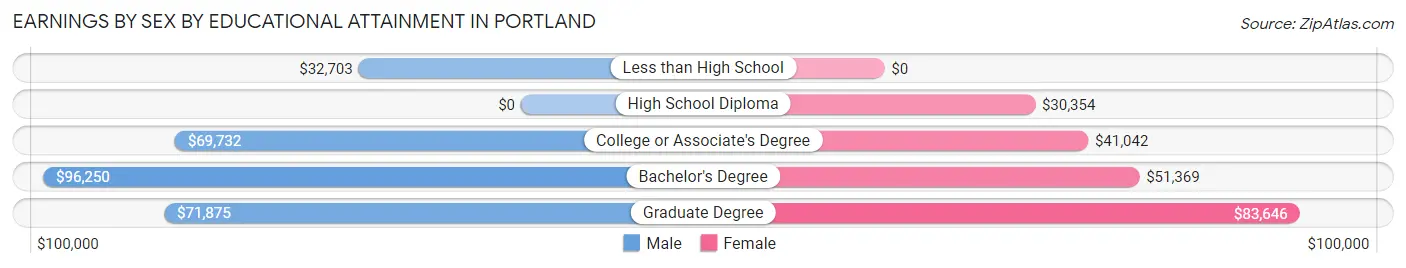
Earnings by Sex by Educational Attainment in Portland
Average earnings in Portland are $67,917 for men and $46,943 for women, a difference of 30.9%. Men with an educational attainment of bachelor's degree enjoy the highest average annual earnings of $96,250, while those with less than high school education earn the least with $32,703. Women with an educational attainment of graduate degree earn the most with the average annual earnings of $83,646, while those with high school diploma education have the smallest earnings of $30,354.
| Educational Attainment | Male Income | Female Income |
| Less than High School | $32,703 | $0 |
| High School Diploma | - | - |
| College or Associate's Degree | $69,732 | $41,042 |
| Bachelor's Degree | $96,250 | $51,369 |
| Graduate Degree | $71,875 | $83,646 |
| Total | $67,917 | $46,943 |
Family Income in Portland
Family Income Brackets in Portland
According to the Portland family income data, there are 458 families falling into the $150,000 to $199,999 income range, which is the most common income bracket and makes up 26.9% of all families.
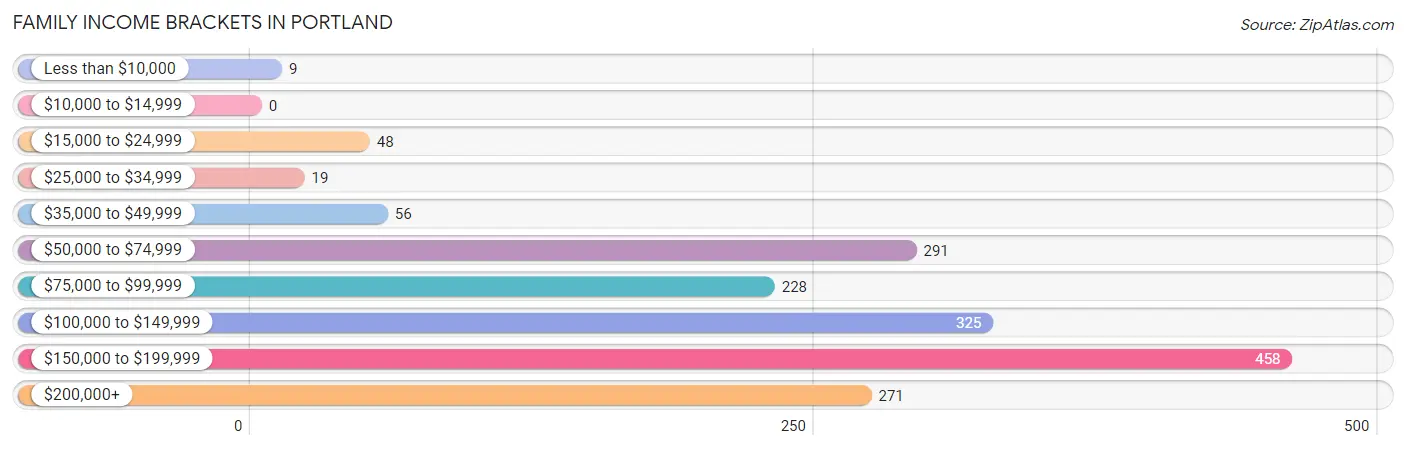
| Income Bracket | # Families | % Families |
| Less than $10,000 | 9 | 0.5% |
| $10,000 to $14,999 | 0 | 0.0% |
| $15,000 to $24,999 | 48 | 2.8% |
| $25,000 to $34,999 | 19 | 1.1% |
| $35,000 to $49,999 | 56 | 3.3% |
| $50,000 to $74,999 | 291 | 17.1% |
| $75,000 to $99,999 | 228 | 13.4% |
| $100,000 to $149,999 | 325 | 19.1% |
| $150,000 to $199,999 | 458 | 26.9% |
| $200,000+ | 271 | 15.9% |
Family Income by Famaliy Size in Portland
6-person families (37 | 2.2%) account for the highest median family income in Portland with $230,489 per family, while 2-person families (753 | 44.2%) have the highest median income of $79,411 per family member.
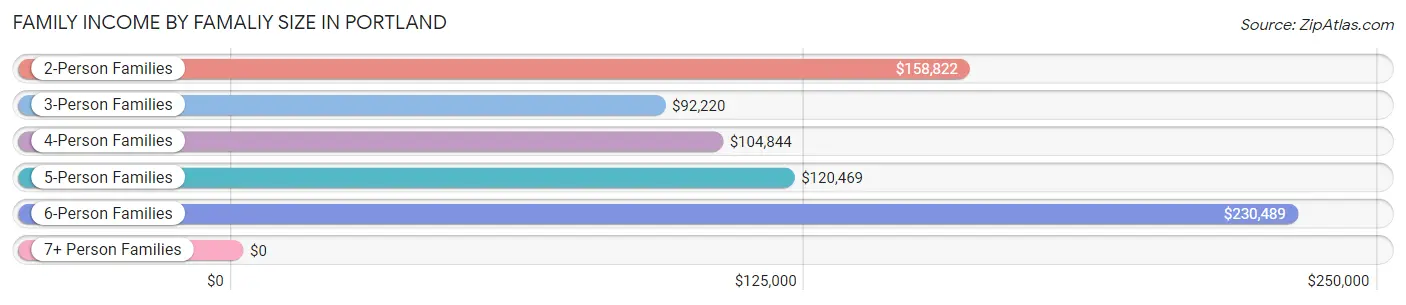
| Income Bracket | # Families | Median Income |
| 2-Person Families | 753 (44.2%) | $158,822 |
| 3-Person Families | 431 (25.3%) | $92,220 |
| 4-Person Families | 305 (17.9%) | $104,844 |
| 5-Person Families | 161 (9.5%) | $120,469 |
| 6-Person Families | 37 (2.2%) | $230,489 |
| 7+ Person Families | 17 (1.0%) | $0 |
| Total | 1,704 (100.0%) | $135,427 |
Family Income by Number of Earners in Portland
The median family income in Portland is $135,427, with families comprising 3+ earners (234) having the highest median family income of $180,694, while families with no earners (145) have the lowest median family income of $50,104, accounting for 13.7% and 8.5% of families, respectively.
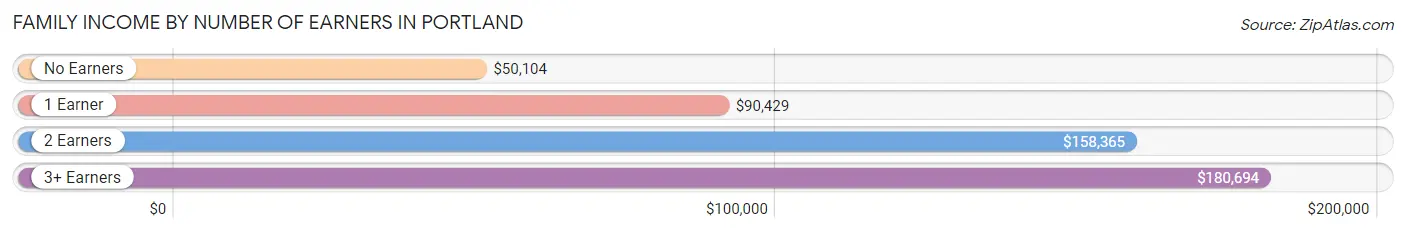
| Number of Earners | # Families | Median Income |
| No Earners | 145 (8.5%) | $50,104 |
| 1 Earner | 439 (25.8%) | $90,429 |
| 2 Earners | 886 (52.0%) | $158,365 |
| 3+ Earners | 234 (13.7%) | $180,694 |
| Total | 1,704 (100.0%) | $135,427 |
Household Income in Portland
Household Income Brackets in Portland
With 533 households falling in the category, the $150,000 to $199,999 income range is the most frequent in Portland, accounting for 21.3% of all households. In contrast, only 58 households (2.3%) fall into the less than $10,000 income bracket, making it the least populous group.
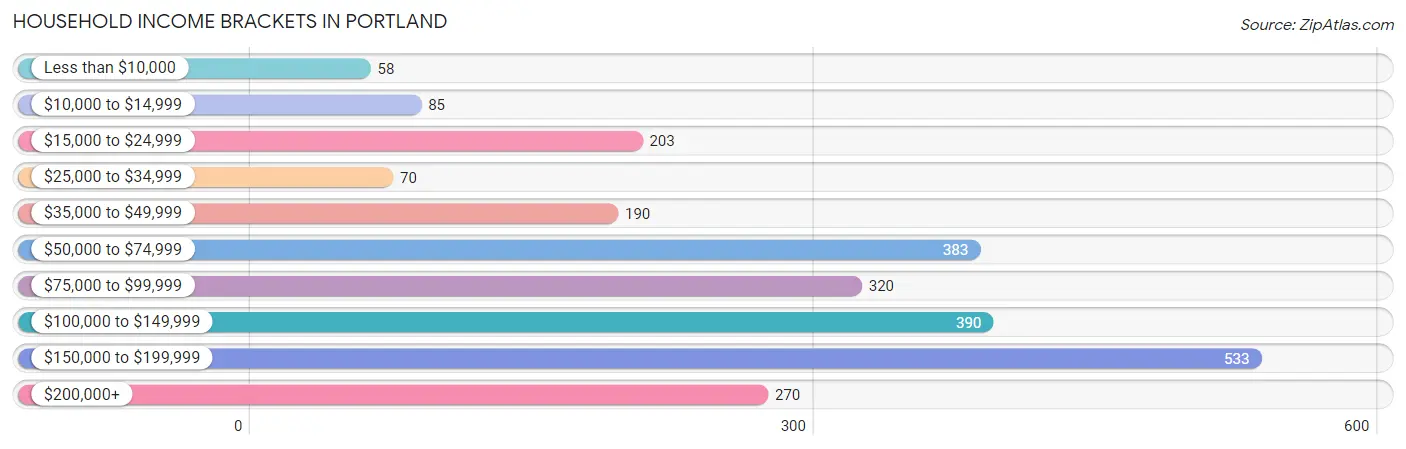
| Income Bracket | # Households | % Households |
| Less than $10,000 | 58 | 2.3% |
| $10,000 to $14,999 | 85 | 3.4% |
| $15,000 to $24,999 | 203 | 8.1% |
| $25,000 to $34,999 | 70 | 2.8% |
| $35,000 to $49,999 | 190 | 7.6% |
| $50,000 to $74,999 | 383 | 15.3% |
| $75,000 to $99,999 | 320 | 12.8% |
| $100,000 to $149,999 | 390 | 15.6% |
| $150,000 to $199,999 | 533 | 21.3% |
| $200,000+ | 270 | 10.8% |
Household Income by Householder Age in Portland
The median household income in Portland is $94,923, with the highest median household income of $157,125 found in the 25 to 44 years age bracket for the primary householder. A total of 957 households (38.3%) fall into this category. Meanwhile, the 15 to 24 years age bracket for the primary householder has the lowest median household income of $0, with 48 households (1.9%) in this group.
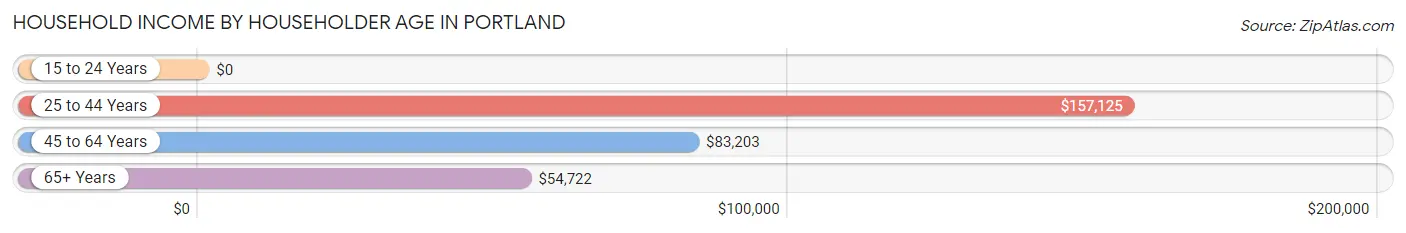
| Income Bracket | # Households | Median Income |
| 15 to 24 Years | 48 (1.9%) | $0 |
| 25 to 44 Years | 957 (38.3%) | $157,125 |
| 45 to 64 Years | 871 (34.8%) | $83,203 |
| 65+ Years | 626 (25.0%) | $54,722 |
| Total | 2,502 (100.0%) | $94,923 |
Poverty in Portland
Income Below Poverty by Sex and Age in Portland
With 4.0% poverty level for males and 6.9% for females among the residents of Portland, 6 to 11 year old males and 55 to 64 year old females are the most vulnerable to poverty, with 34 males (16.8%) and 108 females (26.4%) in their respective age groups living below the poverty level.
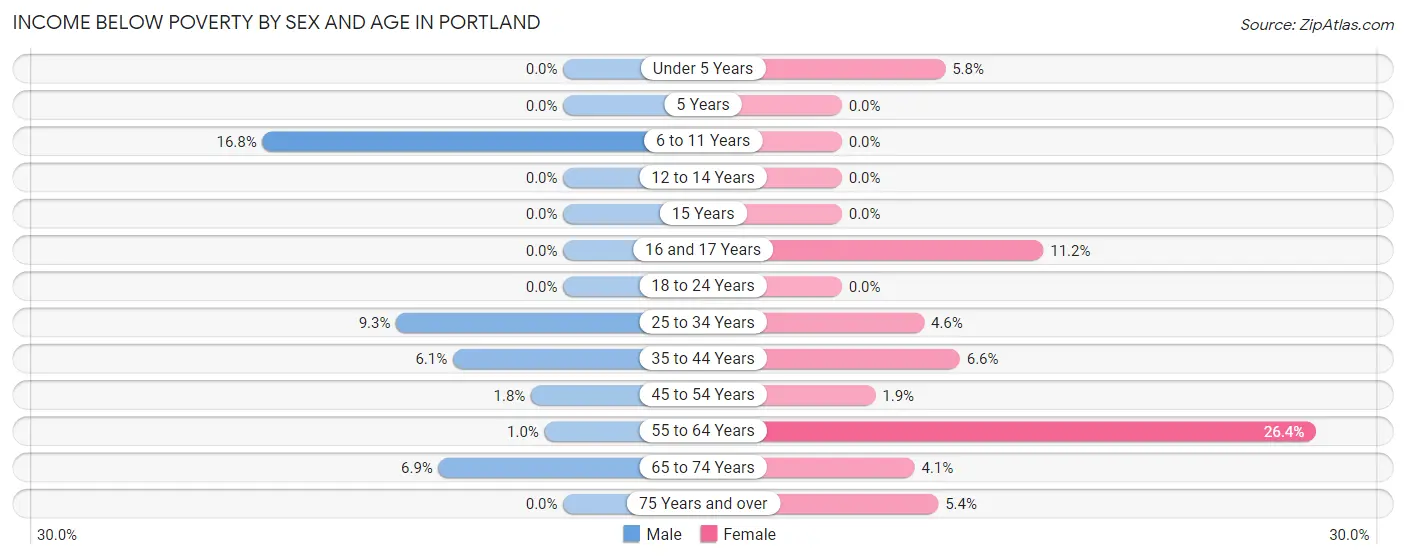
| Age Bracket | Male | Female |
| Under 5 Years | 0 (0.0%) | 11 (5.8%) |
| 5 Years | 0 (0.0%) | 0 (0.0%) |
| 6 to 11 Years | 34 (16.8%) | 0 (0.0%) |
| 12 to 14 Years | 0 (0.0%) | 0 (0.0%) |
| 15 Years | 0 (0.0%) | 0 (0.0%) |
| 16 and 17 Years | 0 (0.0%) | 11 (11.2%) |
| 18 to 24 Years | 0 (0.0%) | 0 (0.0%) |
| 25 to 34 Years | 28 (9.3%) | 24 (4.6%) |
| 35 to 44 Years | 43 (6.1%) | 31 (6.6%) |
| 45 to 54 Years | 9 (1.8%) | 8 (1.9%) |
| 55 to 64 Years | 3 (1.0%) | 108 (26.4%) |
| 65 to 74 Years | 10 (6.9%) | 10 (4.1%) |
| 75 Years and over | 0 (0.0%) | 13 (5.4%) |
| Total | 127 (4.0%) | 216 (6.9%) |
Income Above Poverty by Sex and Age in Portland
According to the poverty statistics in Portland, males aged under 5 years and females aged 5 years are the age groups that are most secure financially, with 100.0% of males and 100.0% of females in these age groups living above the poverty line.
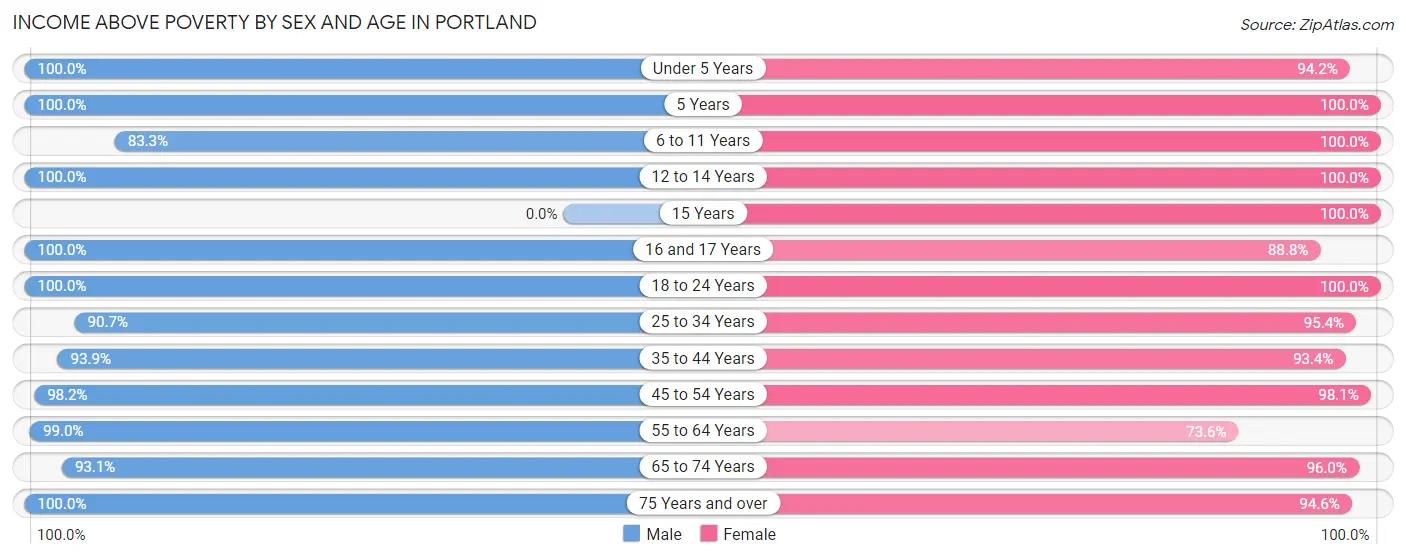
| Age Bracket | Male | Female |
| Under 5 Years | 170 (100.0%) | 180 (94.2%) |
| 5 Years | 38 (100.0%) | 42 (100.0%) |
| 6 to 11 Years | 169 (83.3%) | 250 (100.0%) |
| 12 to 14 Years | 226 (100.0%) | 51 (100.0%) |
| 15 Years | 0 (0.0%) | 47 (100.0%) |
| 16 and 17 Years | 89 (100.0%) | 87 (88.8%) |
| 18 to 24 Years | 254 (100.0%) | 127 (100.0%) |
| 25 to 34 Years | 273 (90.7%) | 500 (95.4%) |
| 35 to 44 Years | 657 (93.9%) | 441 (93.4%) |
| 45 to 54 Years | 495 (98.2%) | 420 (98.1%) |
| 55 to 64 Years | 286 (99.0%) | 301 (73.6%) |
| 65 to 74 Years | 134 (93.1%) | 237 (96.0%) |
| 75 Years and over | 278 (100.0%) | 229 (94.6%) |
| Total | 3,069 (96.0%) | 2,912 (93.1%) |
Income Below Poverty Among Married-Couple Families in Portland
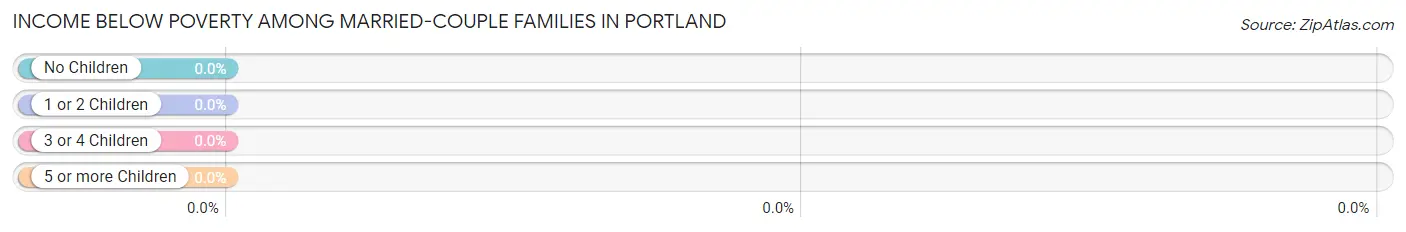
| Children | Above Poverty | Below Poverty |
| No Children | 846 (100.0%) | 0 (0.0%) |
| 1 or 2 Children | 416 (100.0%) | 0 (0.0%) |
| 3 or 4 Children | 112 (100.0%) | 0 (0.0%) |
| 5 or more Children | 0 (0.0%) | 0 (0.0%) |
| Total | 1,374 (100.0%) | 0 (0.0%) |
Income Below Poverty Among Single-Parent Households in Portland
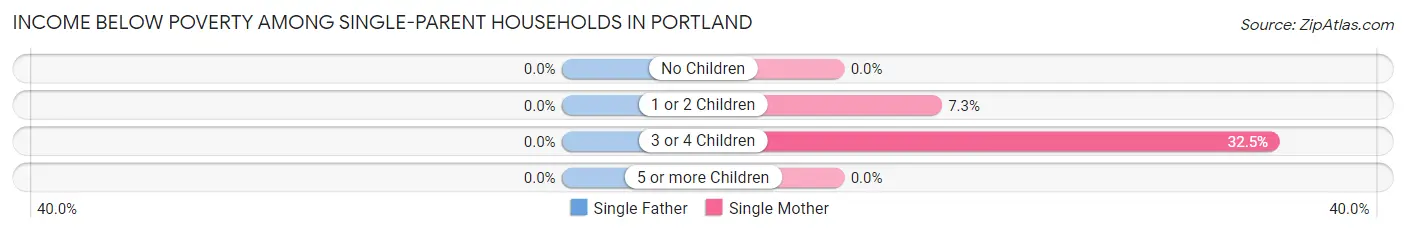
| Children | Single Father | Single Mother |
| No Children | 0 (0.0%) | 0 (0.0%) |
| 1 or 2 Children | 0 (0.0%) | 8 (7.3%) |
| 3 or 4 Children | 0 (0.0%) | 13 (32.5%) |
| 5 or more Children | 0 (0.0%) | 0 (0.0%) |
| Total | 0 (0.0%) | 21 (9.3%) |
Income Below Poverty Among Married-Couple vs Single-Parent Households in Portland
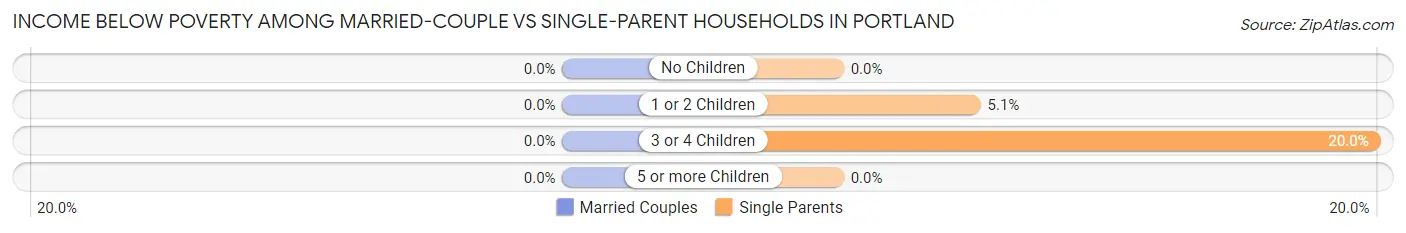
| Children | Married-Couple Families | Single-Parent Households |
| No Children | 0 (0.0%) | 0 (0.0%) |
| 1 or 2 Children | 0 (0.0%) | 8 (5.1%) |
| 3 or 4 Children | 0 (0.0%) | 13 (20.0%) |
| 5 or more Children | 0 (0.0%) | 0 (0.0%) |
| Total | 0 (0.0%) | 21 (6.4%) |
Race in Portland
The most populous races in Portland are White / Caucasian (5,667 | 88.3%), Hispanic or Latino (391 | 6.1%), and Two or more Races (332 | 5.2%).
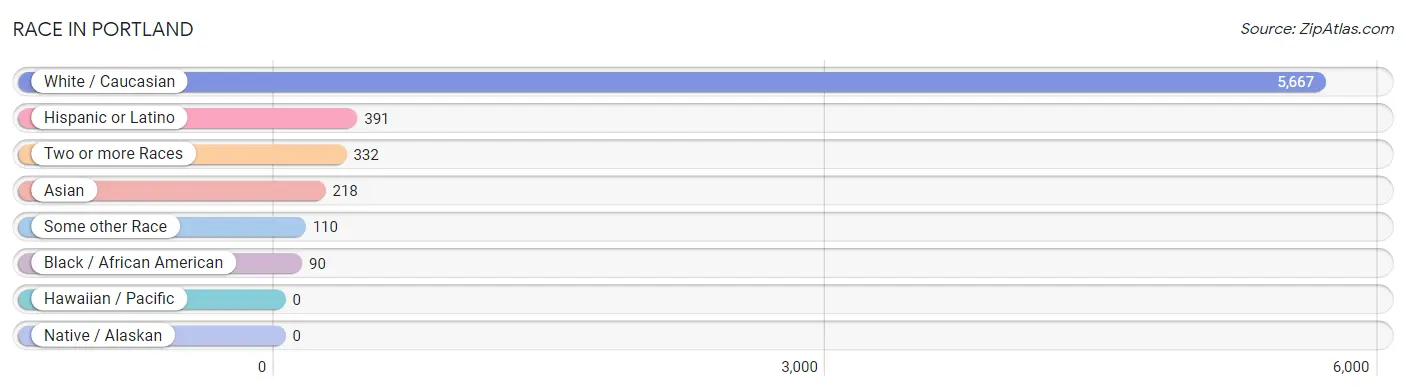
| Race | # Population | % Population |
| Asian | 218 | 3.4% |
| Black / African American | 90 | 1.4% |
| Hawaiian / Pacific | 0 | 0.0% |
| Hispanic or Latino | 391 | 6.1% |
| Native / Alaskan | 0 | 0.0% |
| White / Caucasian | 5,667 | 88.3% |
| Two or more Races | 332 | 5.2% |
| Some other Race | 110 | 1.7% |
| Total | 6,417 | 100.0% |
Ancestry in Portland
The most populous ancestries reported in Portland are Italian (1,444 | 22.5%), Irish (1,262 | 19.7%), Polish (807 | 12.6%), English (548 | 8.5%), and German (542 | 8.5%), together accounting for 71.7% of all Portland residents.
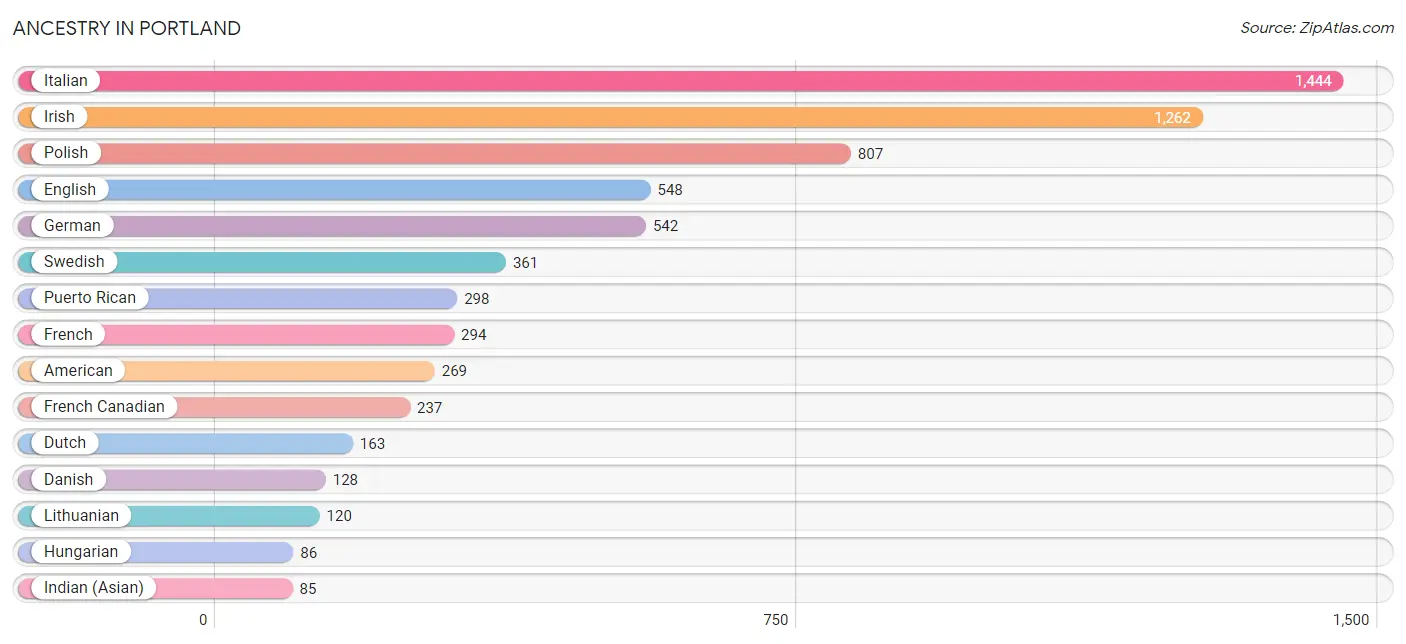
| Ancestry | # Population | % Population |
| American | 269 | 4.2% |
| Austrian | 17 | 0.3% |
| British | 36 | 0.6% |
| Burmese | 69 | 1.1% |
| Czech | 34 | 0.5% |
| Danish | 128 | 2.0% |
| Dutch | 163 | 2.5% |
| Eastern European | 6 | 0.1% |
| English | 548 | 8.5% |
| European | 82 | 1.3% |
| Finnish | 51 | 0.8% |
| French | 294 | 4.6% |
| French Canadian | 237 | 3.7% |
| German | 542 | 8.5% |
| Greek | 5 | 0.1% |
| Hungarian | 86 | 1.3% |
| Indian (Asian) | 85 | 1.3% |
| Irish | 1,262 | 19.7% |
| Italian | 1,444 | 22.5% |
| Lithuanian | 120 | 1.9% |
| Mexican | 33 | 0.5% |
| Norwegian | 11 | 0.2% |
| Pakistani | 64 | 1.0% |
| Peruvian | 49 | 0.8% |
| Polish | 807 | 12.6% |
| Portuguese | 5 | 0.1% |
| Puerto Rican | 298 | 4.6% |
| Romanian | 8 | 0.1% |
| Russian | 39 | 0.6% |
| Scottish | 83 | 1.3% |
| Slovak | 43 | 0.7% |
| South American | 49 | 0.8% |
| Swedish | 361 | 5.6% | View All 33 Rows |
Immigrants in Portland
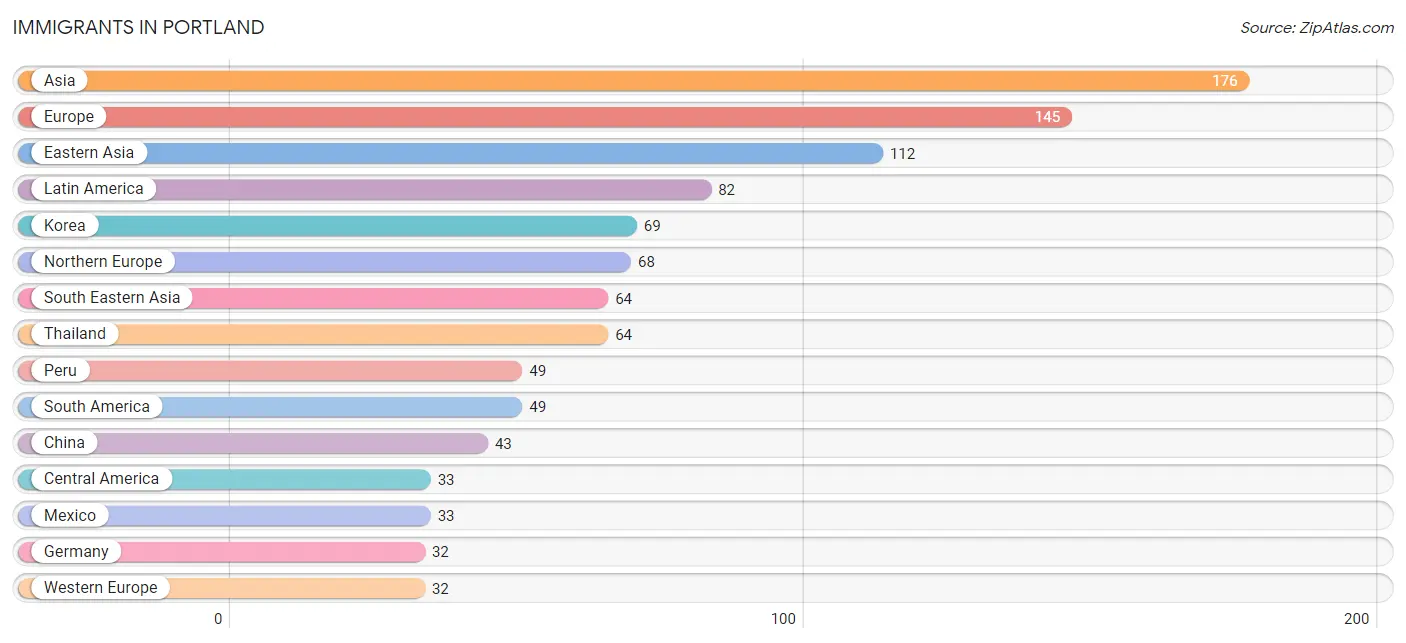
The most numerous immigrant groups reported in Portland came from Asia (176 | 2.7%), Europe (145 | 2.3%), Eastern Asia (112 | 1.8%), Latin America (82 | 1.3%), and Korea (69 | 1.1%), together accounting for 9.1% of all Portland residents.
| Immigration Origin | # Population | % Population |
| Asia | 176 | 2.7% |
| Central America | 33 | 0.5% |
| China | 43 | 0.7% |
| Eastern Asia | 112 | 1.8% |
| Eastern Europe | 23 | 0.4% |
| Europe | 145 | 2.3% |
| Germany | 32 | 0.5% |
| Italy | 22 | 0.3% |
| Korea | 69 | 1.1% |
| Latin America | 82 | 1.3% |
| Mexico | 33 | 0.5% |
| Northern Europe | 68 | 1.1% |
| Peru | 49 | 0.8% |
| Poland | 5 | 0.1% |
| Russia | 18 | 0.3% |
| South America | 49 | 0.8% |
| South Eastern Asia | 64 | 1.0% |
| Southern Europe | 22 | 0.3% |
| Thailand | 64 | 1.0% |
| Western Europe | 32 | 0.5% | View All 20 Rows |
Sex and Age in Portland
Sex and Age in Portland
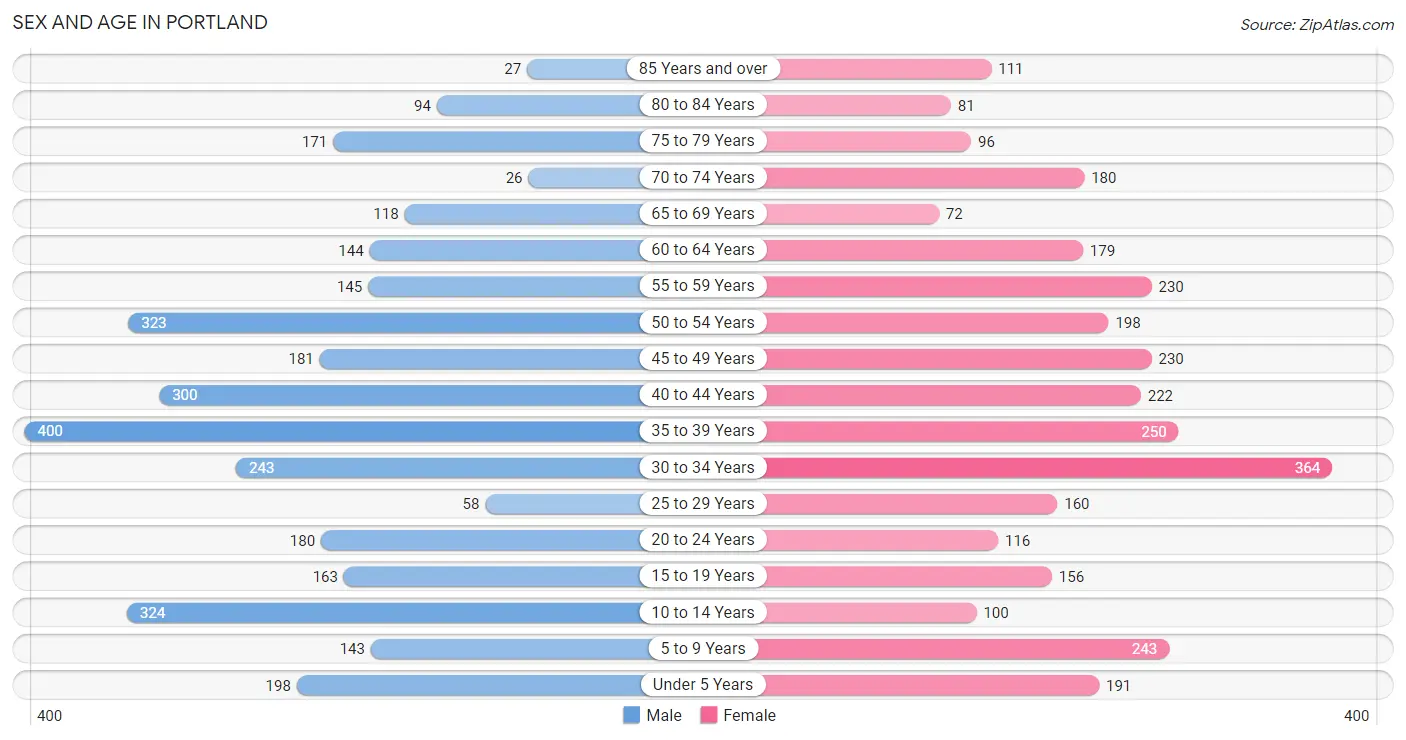
The most populous age groups in Portland are 35 to 39 Years (400 | 12.3%) for men and 30 to 34 Years (364 | 11.5%) for women.
| Age Bracket | Male | Female |
| Under 5 Years | 198 (6.1%) | 191 (6.0%) |
| 5 to 9 Years | 143 (4.4%) | 243 (7.6%) |
| 10 to 14 Years | 324 (10.0%) | 100 (3.2%) |
| 15 to 19 Years | 163 (5.0%) | 156 (4.9%) |
| 20 to 24 Years | 180 (5.6%) | 116 (3.6%) |
| 25 to 29 Years | 58 (1.8%) | 160 (5.0%) |
| 30 to 34 Years | 243 (7.5%) | 364 (11.5%) |
| 35 to 39 Years | 400 (12.3%) | 250 (7.9%) |
| 40 to 44 Years | 300 (9.3%) | 222 (7.0%) |
| 45 to 49 Years | 181 (5.6%) | 230 (7.2%) |
| 50 to 54 Years | 323 (10.0%) | 198 (6.2%) |
| 55 to 59 Years | 145 (4.5%) | 230 (7.2%) |
| 60 to 64 Years | 144 (4.4%) | 179 (5.6%) |
| 65 to 69 Years | 118 (3.6%) | 72 (2.3%) |
| 70 to 74 Years | 26 (0.8%) | 180 (5.7%) |
| 75 to 79 Years | 171 (5.3%) | 96 (3.0%) |
| 80 to 84 Years | 94 (2.9%) | 81 (2.5%) |
| 85 Years and over | 27 (0.8%) | 111 (3.5%) |
| Total | 3,238 (100.0%) | 3,179 (100.0%) |
Families and Households in Portland
Median Family Size in Portland
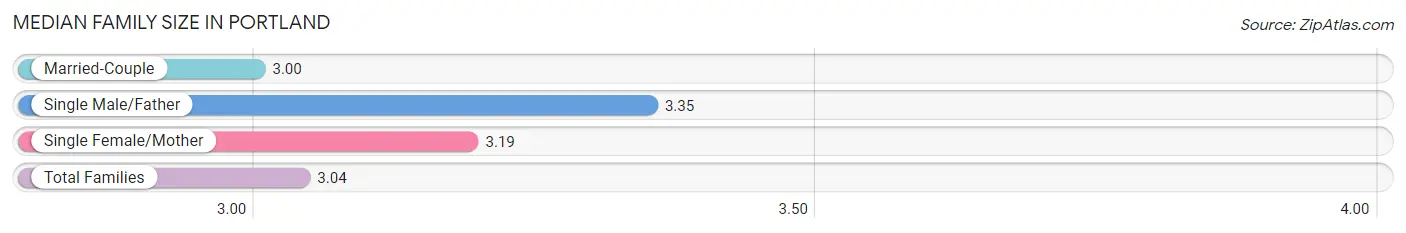
The median family size in Portland is 3.04 persons per family, with single male/father families (104 | 6.1%) accounting for the largest median family size of 3.35 persons per family. On the other hand, married-couple families (1,374 | 80.6%) represent the smallest median family size with 3.00 persons per family.
| Family Type | # Families | Family Size |
| Married-Couple | 1,374 (80.6%) | 3.00 |
| Single Male/Father | 104 (6.1%) | 3.35 |
| Single Female/Mother | 226 (13.3%) | 3.19 |
| Total Families | 1,704 (100.0%) | 3.04 |
Median Household Size in Portland
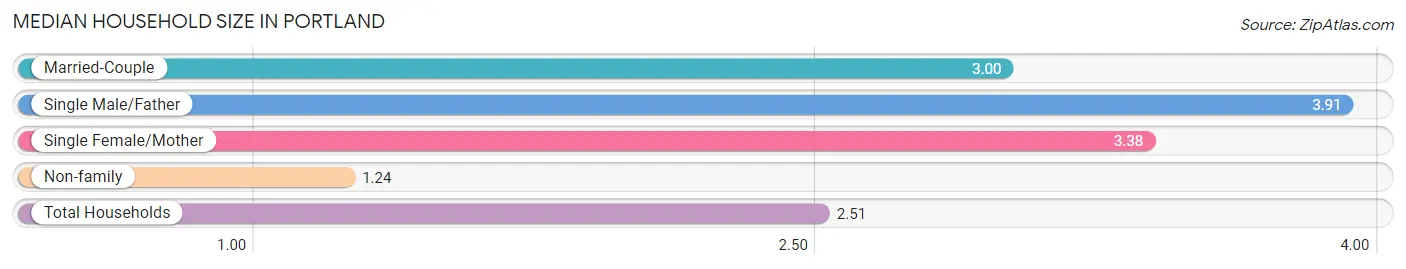
The median household size in Portland is 2.51 persons per household, with single male/father households (104 | 4.2%) accounting for the largest median household size of 3.91 persons per household. non-family households (798 | 31.9%) represent the smallest median household size with 1.24 persons per household.
| Household Type | # Households | Household Size |
| Married-Couple | 1,374 (54.9%) | 3.00 |
| Single Male/Father | 104 (4.2%) | 3.91 |
| Single Female/Mother | 226 (9.0%) | 3.38 |
| Non-family | 798 (31.9%) | 1.24 |
| Total Households | 2,502 (100.0%) | 2.51 |
Household Size by Marriage Status in Portland
Out of a total of 2,502 households in Portland, 1,704 (68.1%) are family households, while 798 (31.9%) are nonfamily households. The most numerous type of family households are 2-person households, comprising 718, and the most common type of nonfamily households are 1-person households, comprising 647.
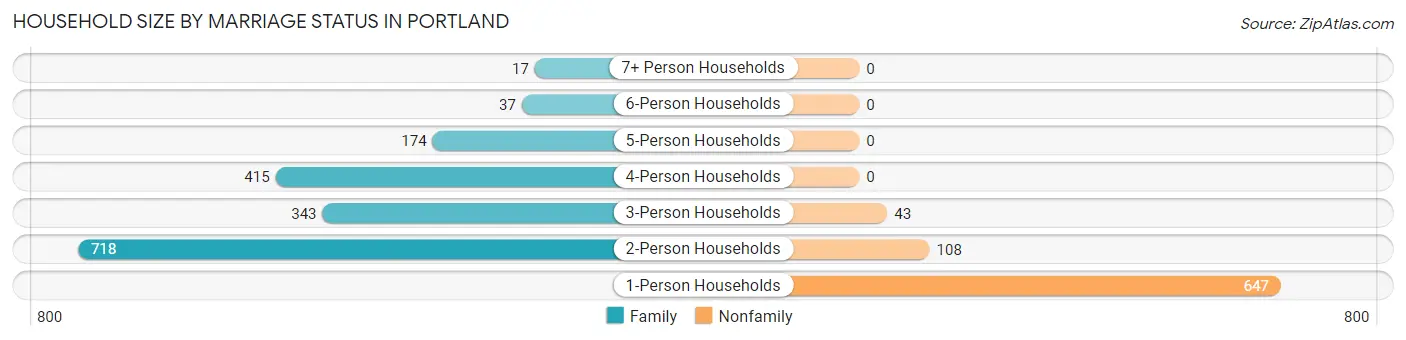
| Household Size | Family Households | Nonfamily Households |
| 1-Person Households | - | 647 (25.9%) |
| 2-Person Households | 718 (28.7%) | 108 (4.3%) |
| 3-Person Households | 343 (13.7%) | 43 (1.7%) |
| 4-Person Households | 415 (16.6%) | 0 (0.0%) |
| 5-Person Households | 174 (7.0%) | 0 (0.0%) |
| 6-Person Households | 37 (1.5%) | 0 (0.0%) |
| 7+ Person Households | 17 (0.7%) | 0 (0.0%) |
| Total | 1,704 (68.1%) | 798 (31.9%) |
Female Fertility in Portland
Fertility by Age in Portland
Average fertility rate in Portland is 13.0 births per 1,000 women. Women in the age bracket of 35 to 50 years have the highest fertility rate with 15.0 births per 1,000 women. Women in the age bracket of 35 to 50 years acount for 55.0% of all women with births.
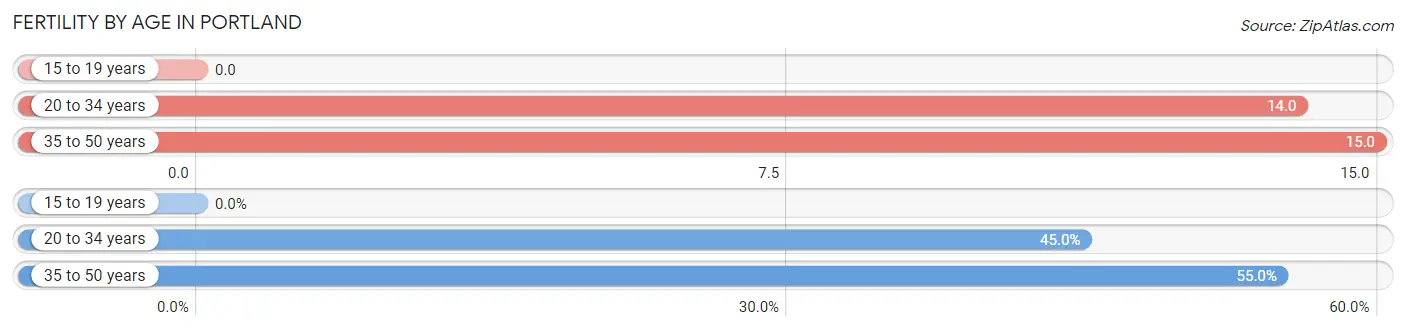
| Age Bracket | Women with Births | Births / 1,000 Women |
| 15 to 19 years | 0 (0.0%) | 0.0 |
| 20 to 34 years | 9 (45.0%) | 14.0 |
| 35 to 50 years | 11 (55.0%) | 15.0 |
| Total | 20 (100.0%) | 13.0 |
Fertility by Age by Marriage Status in Portland
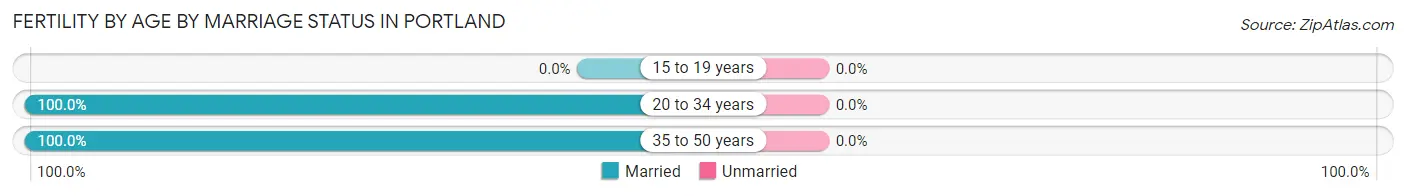
| Age Bracket | Married | Unmarried |
| 15 to 19 years | 0 (0.0%) | 0 (0.0%) |
| 20 to 34 years | 9 (100.0%) | 0 (0.0%) |
| 35 to 50 years | 11 (100.0%) | 0 (0.0%) |
| Total | 20 (100.0%) | 0 (0.0%) |
Fertility by Education in Portland
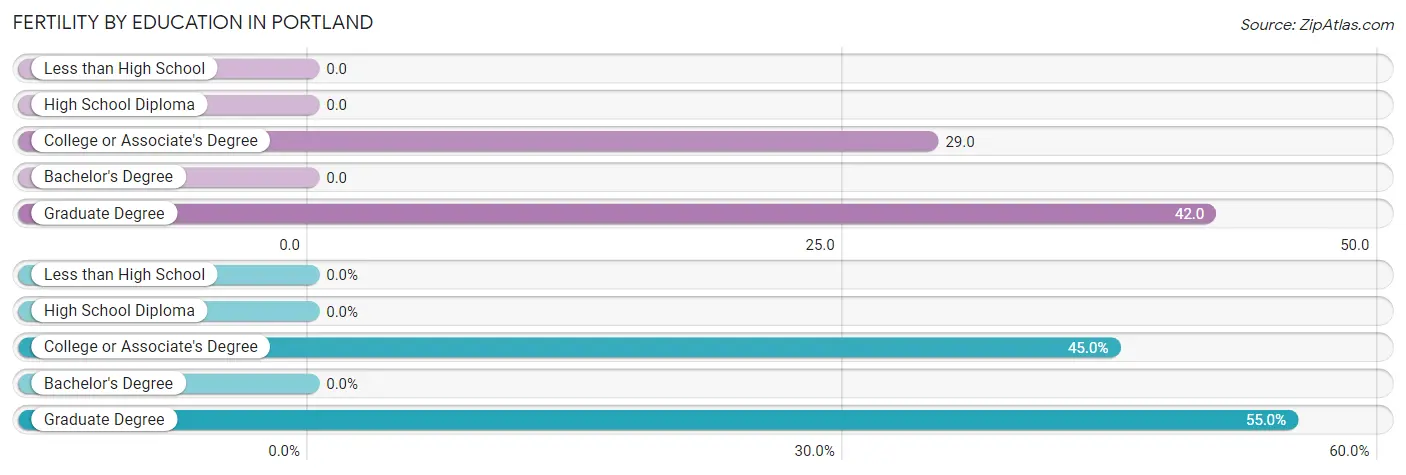
| Educational Attainment | Women with Births | Births / 1,000 Women |
| Less than High School | 0 (0.0%) | 0.0 |
| High School Diploma | 0 (0.0%) | 0.0 |
| College or Associate's Degree | 9 (45.0%) | 29.0 |
| Bachelor's Degree | 0 (0.0%) | 0.0 |
| Graduate Degree | 11 (55.0%) | 42.0 |
| Total | 20 (100.0%) | 13.0 |
Fertility by Education by Marriage Status in Portland
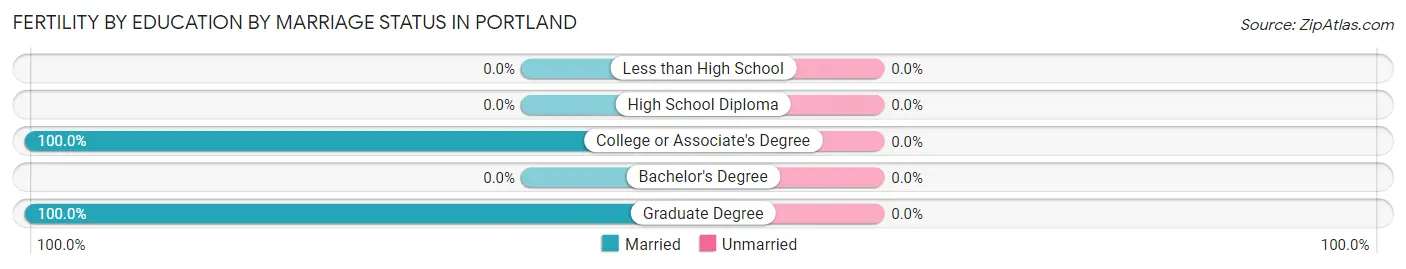
| Educational Attainment | Married | Unmarried |
| Less than High School | 0 (0.0%) | 0 (0.0%) |
| High School Diploma | 0 (0.0%) | 0 (0.0%) |
| College or Associate's Degree | 9 (100.0%) | 0 (0.0%) |
| Bachelor's Degree | 0 (0.0%) | 0 (0.0%) |
| Graduate Degree | 11 (100.0%) | 0 (0.0%) |
| Total | 20 (100.0%) | 0 (0.0%) |
Employment Characteristics in Portland
Employment by Class of Employer in Portland
Among the 3,491 employed individuals in Portland, private company employees (2,413 | 69.1%), not-for-profit organizations (326 | 9.3%), and local government employees (234 | 6.7%) make up the most common classes of employment.
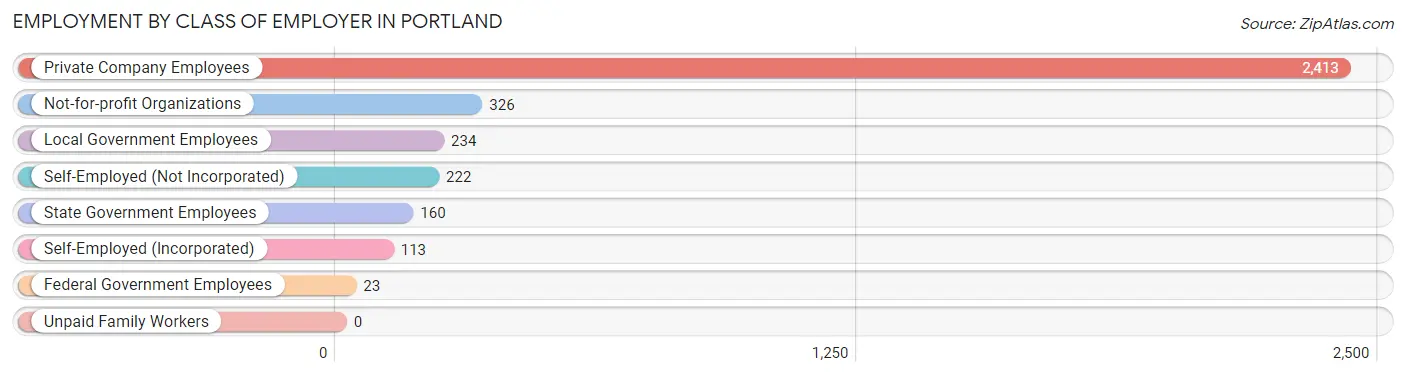
| Employer Class | # Employees | % Employees |
| Private Company Employees | 2,413 | 69.1% |
| Self-Employed (Incorporated) | 113 | 3.2% |
| Self-Employed (Not Incorporated) | 222 | 6.4% |
| Not-for-profit Organizations | 326 | 9.3% |
| Local Government Employees | 234 | 6.7% |
| State Government Employees | 160 | 4.6% |
| Federal Government Employees | 23 | 0.7% |
| Unpaid Family Workers | 0 | 0.0% |
| Total | 3,491 | 100.0% |
Employment Status by Age in Portland
According to the labor force statistics for Portland, out of the total population over 16 years of age (5,171), 72.9% or 3,770 individuals are in the labor force, with 6.3% or 238 of them unemployed. The age group with the highest labor force participation rate is 45 to 54 years, with 95.1% or 886 individuals in the labor force. Within the labor force, the 55 to 59 years age range has the highest percentage of unemployed individuals, with 25.3% or 71 of them being unemployed.
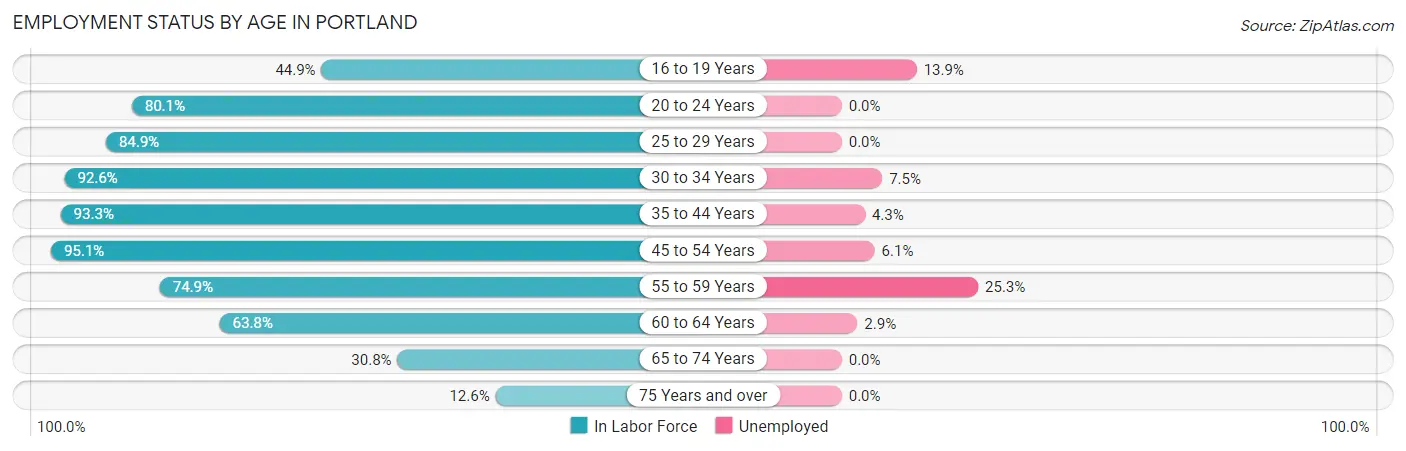
| Age Bracket | In Labor Force | Unemployed |
| 16 to 19 Years | 122 (44.9%) | 17 (13.9%) |
| 20 to 24 Years | 237 (80.1%) | 0 (0.0%) |
| 25 to 29 Years | 185 (84.9%) | 0 (0.0%) |
| 30 to 34 Years | 562 (92.6%) | 42 (7.5%) |
| 35 to 44 Years | 1,093 (93.3%) | 47 (4.3%) |
| 45 to 54 Years | 886 (95.1%) | 54 (6.1%) |
| 55 to 59 Years | 281 (74.9%) | 71 (25.3%) |
| 60 to 64 Years | 206 (63.8%) | 6 (2.9%) |
| 65 to 74 Years | 122 (30.8%) | 0 (0.0%) |
| 75 Years and over | 73 (12.6%) | 0 (0.0%) |
| Total | 3,770 (72.9%) | 238 (6.3%) |
Employment Status by Educational Attainment in Portland
According to labor force statistics for Portland, 88.6% of individuals (3,214) out of the total population between 25 and 64 years of age (3,627) are in the labor force, with 6.8% or 219 of them being unemployed. The group with the highest labor force participation rate are those with the educational attainment of college / associate degree, with 92.8% or 1,030 individuals in the labor force. Within the labor force, individuals with high school diploma education have the highest percentage of unemployment, with 19.0% or 84 of them being unemployed.
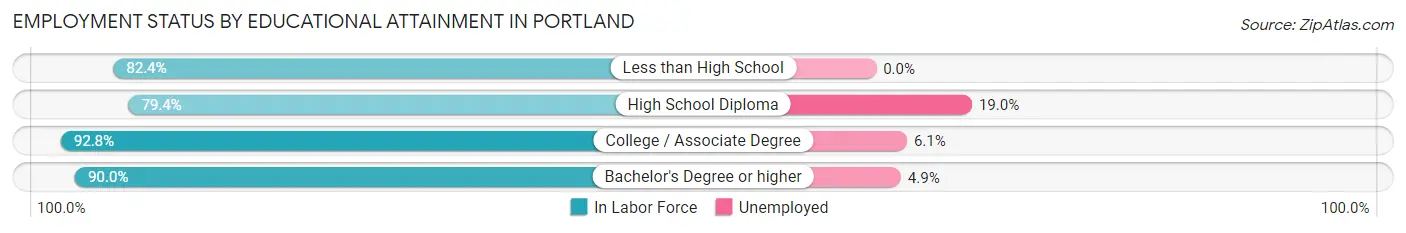
| Educational Attainment | In Labor Force | Unemployed |
| Less than High School | 243 (82.4%) | 0 (0.0%) |
| High School Diploma | 443 (79.4%) | 106 (19.0%) |
| College / Associate Degree | 1,030 (92.8%) | 68 (6.1%) |
| Bachelor's Degree or higher | 1,498 (90.0%) | 82 (4.9%) |
| Total | 3,214 (88.6%) | 247 (6.8%) |
Employment Occupations by Sex in Portland
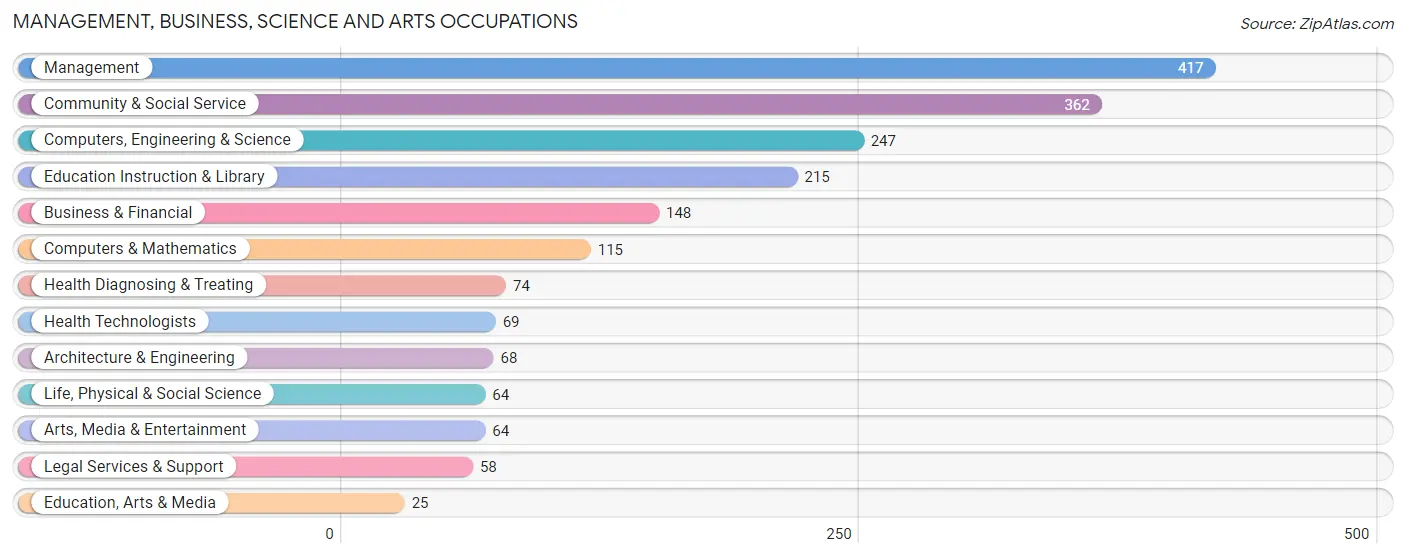
Management, Business, Science and Arts Occupations
The most common Management, Business, Science and Arts occupations in Portland are Management (417 | 11.8%), Community & Social Service (362 | 10.2%), Computers, Engineering & Science (247 | 7.0%), Education Instruction & Library (215 | 6.1%), and Business & Financial (148 | 4.2%).
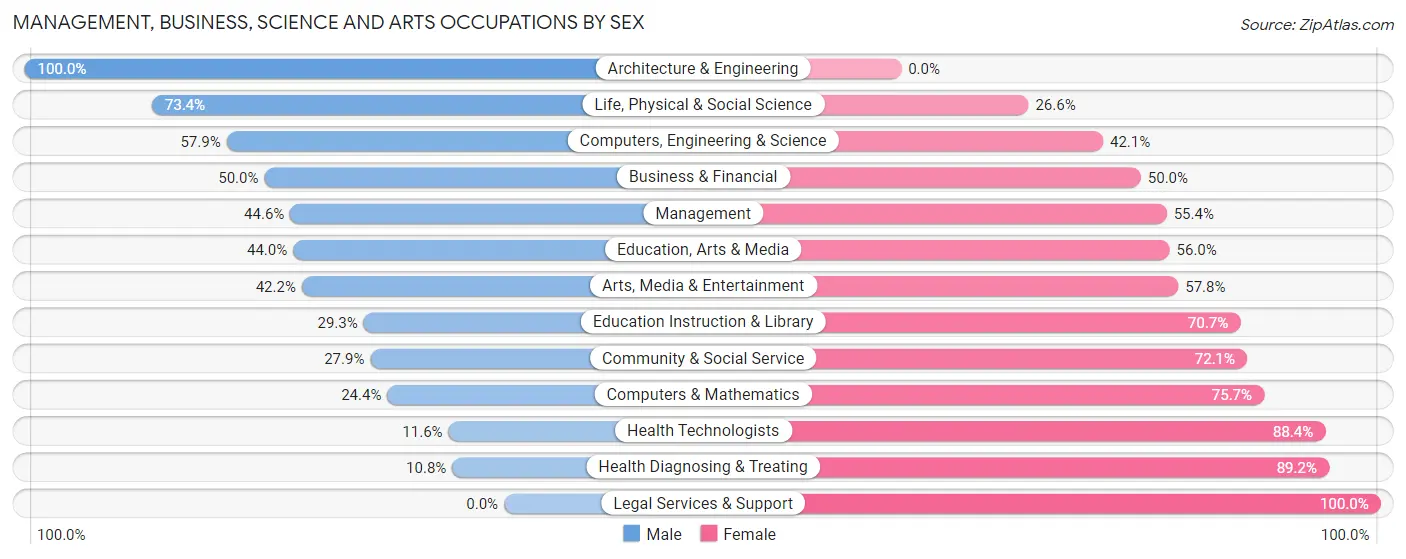
Management, Business, Science and Arts Occupations by Sex
Within the Management, Business, Science and Arts occupations in Portland, the most male-oriented occupations are Architecture & Engineering (100.0%), Life, Physical & Social Science (73.4%), and Computers, Engineering & Science (57.9%), while the most female-oriented occupations are Legal Services & Support (100.0%), Health Diagnosing & Treating (89.2%), and Health Technologists (88.4%).
| Occupation | Male | Female |
| Management | 186 (44.6%) | 231 (55.4%) |
| Business & Financial | 74 (50.0%) | 74 (50.0%) |
| Computers, Engineering & Science | 143 (57.9%) | 104 (42.1%) |
| Computers & Mathematics | 28 (24.3%) | 87 (75.6%) |
| Architecture & Engineering | 68 (100.0%) | 0 (0.0%) |
| Life, Physical & Social Science | 47 (73.4%) | 17 (26.6%) |
| Community & Social Service | 101 (27.9%) | 261 (72.1%) |
| Education, Arts & Media | 11 (44.0%) | 14 (56.0%) |
| Legal Services & Support | 0 (0.0%) | 58 (100.0%) |
| Education Instruction & Library | 63 (29.3%) | 152 (70.7%) |
| Arts, Media & Entertainment | 27 (42.2%) | 37 (57.8%) |
| Health Diagnosing & Treating | 8 (10.8%) | 66 (89.2%) |
| Health Technologists | 8 (11.6%) | 61 (88.4%) |
| Total (Category) | 512 (41.0%) | 736 (59.0%) |
| Total (Overall) | 1,866 (52.8%) | 1,665 (47.1%) |
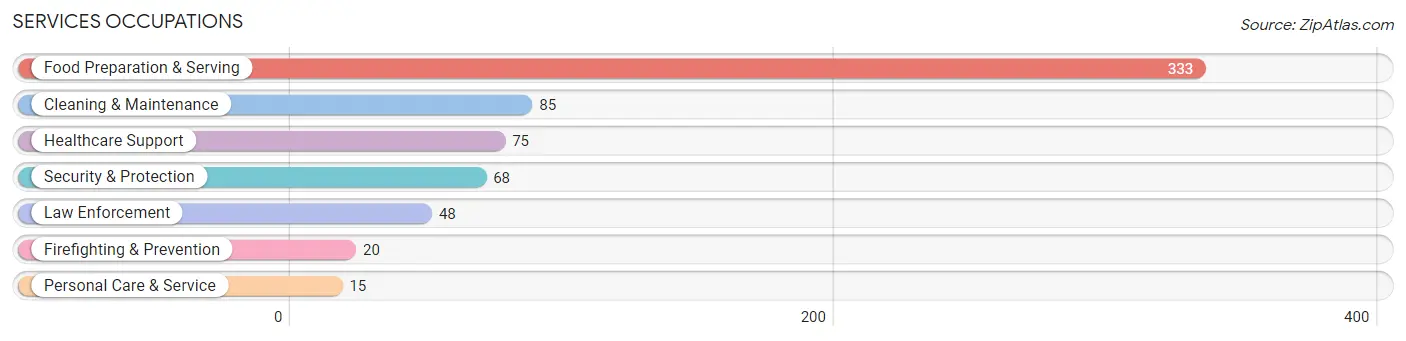
Services Occupations
The most common Services occupations in Portland are Food Preparation & Serving (333 | 9.4%), Cleaning & Maintenance (85 | 2.4%), Healthcare Support (75 | 2.1%), Security & Protection (68 | 1.9%), and Law Enforcement (48 | 1.4%).
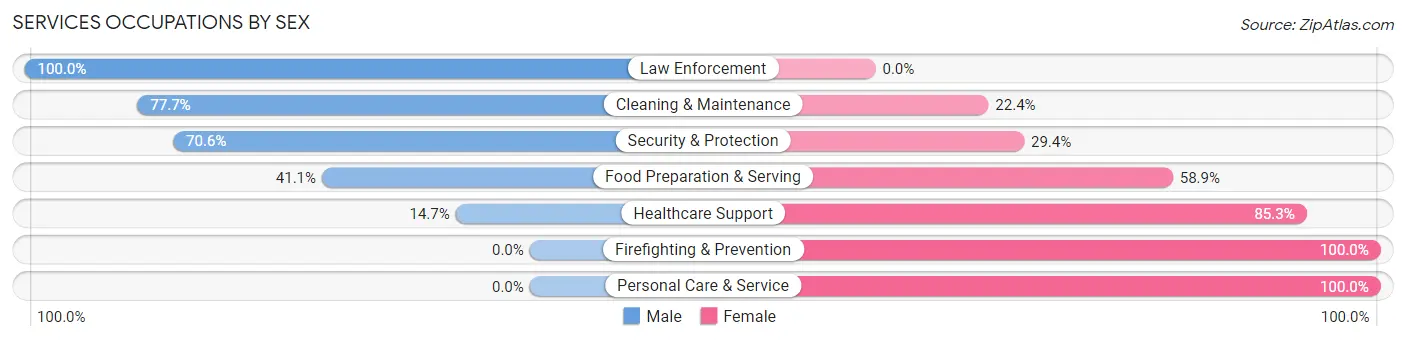
Services Occupations by Sex
Within the Services occupations in Portland, the most male-oriented occupations are Law Enforcement (100.0%), Cleaning & Maintenance (77.6%), and Security & Protection (70.6%), while the most female-oriented occupations are Firefighting & Prevention (100.0%), Personal Care & Service (100.0%), and Healthcare Support (85.3%).
| Occupation | Male | Female |
| Healthcare Support | 11 (14.7%) | 64 (85.3%) |
| Security & Protection | 48 (70.6%) | 20 (29.4%) |
| Firefighting & Prevention | 0 (0.0%) | 20 (100.0%) |
| Law Enforcement | 48 (100.0%) | 0 (0.0%) |
| Food Preparation & Serving | 137 (41.1%) | 196 (58.9%) |
| Cleaning & Maintenance | 66 (77.6%) | 19 (22.4%) |
| Personal Care & Service | 0 (0.0%) | 15 (100.0%) |
| Total (Category) | 262 (45.5%) | 314 (54.5%) |
| Total (Overall) | 1,866 (52.8%) | 1,665 (47.1%) |
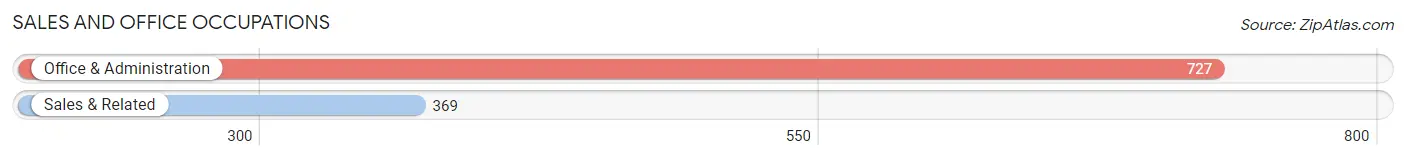
Sales and Office Occupations
The most common Sales and Office occupations in Portland are Office & Administration (727 | 20.6%), and Sales & Related (369 | 10.4%).
Sales and Office Occupations by Sex
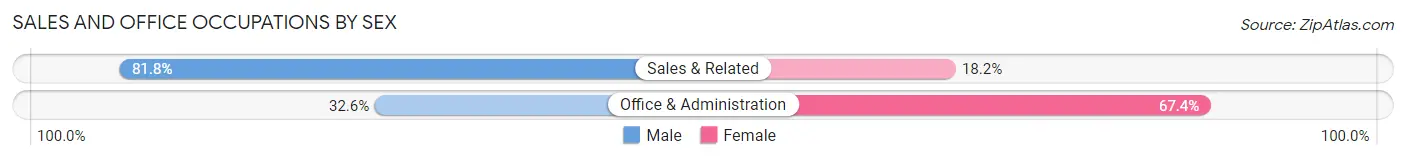
| Occupation | Male | Female |
| Sales & Related | 302 (81.8%) | 67 (18.2%) |
| Office & Administration | 237 (32.6%) | 490 (67.4%) |
| Total (Category) | 539 (49.2%) | 557 (50.8%) |
| Total (Overall) | 1,866 (52.8%) | 1,665 (47.1%) |
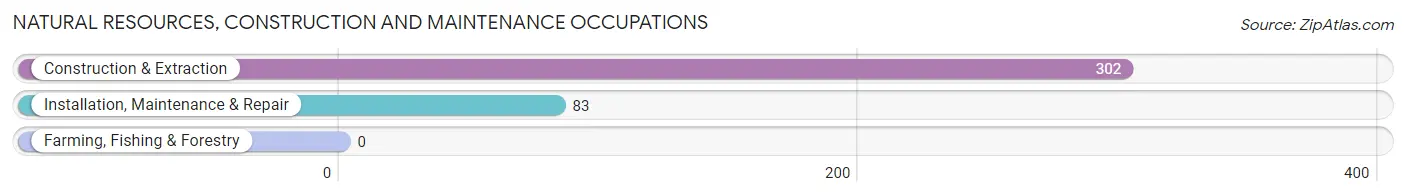
Natural Resources, Construction and Maintenance Occupations
The most common Natural Resources, Construction and Maintenance occupations in Portland are Construction & Extraction (302 | 8.6%), and Installation, Maintenance & Repair (83 | 2.4%).
Natural Resources, Construction and Maintenance Occupations by Sex
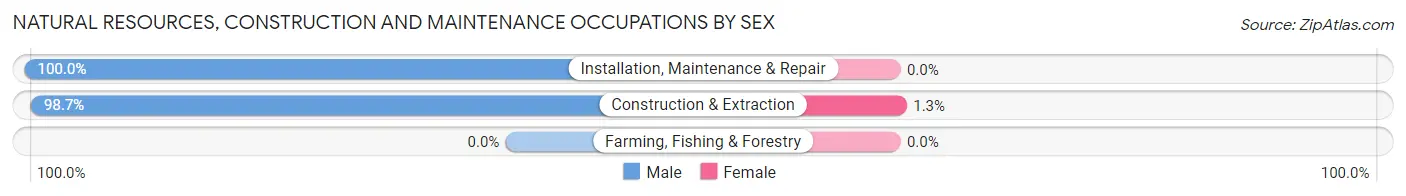
| Occupation | Male | Female |
| Farming, Fishing & Forestry | 0 (0.0%) | 0 (0.0%) |
| Construction & Extraction | 298 (98.7%) | 4 (1.3%) |
| Installation, Maintenance & Repair | 83 (100.0%) | 0 (0.0%) |
| Total (Category) | 381 (99.0%) | 4 (1.0%) |
| Total (Overall) | 1,866 (52.8%) | 1,665 (47.1%) |
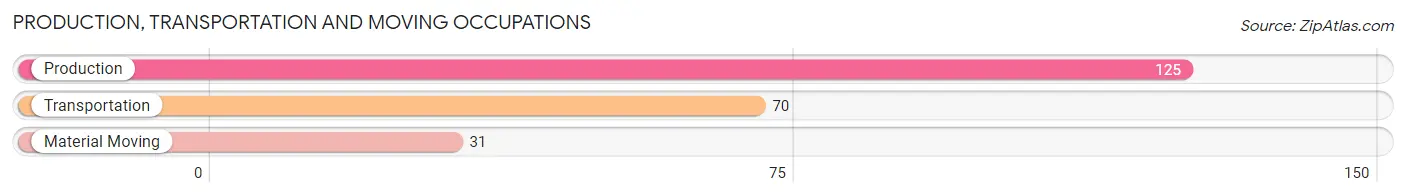
Production, Transportation and Moving Occupations
The most common Production, Transportation and Moving occupations in Portland are Production (125 | 3.5%), Transportation (70 | 2.0%), and Material Moving (31 | 0.9%).
Production, Transportation and Moving Occupations by Sex
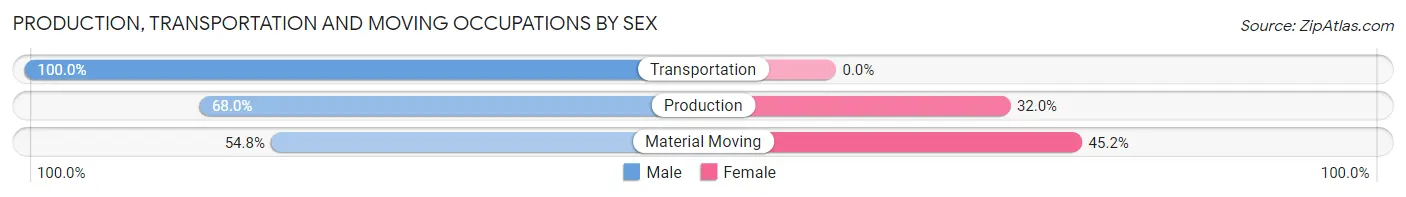
| Occupation | Male | Female |
| Production | 85 (68.0%) | 40 (32.0%) |
| Transportation | 70 (100.0%) | 0 (0.0%) |
| Material Moving | 17 (54.8%) | 14 (45.2%) |
| Total (Category) | 172 (76.1%) | 54 (23.9%) |
| Total (Overall) | 1,866 (52.8%) | 1,665 (47.1%) |
Employment Industries by Sex in Portland
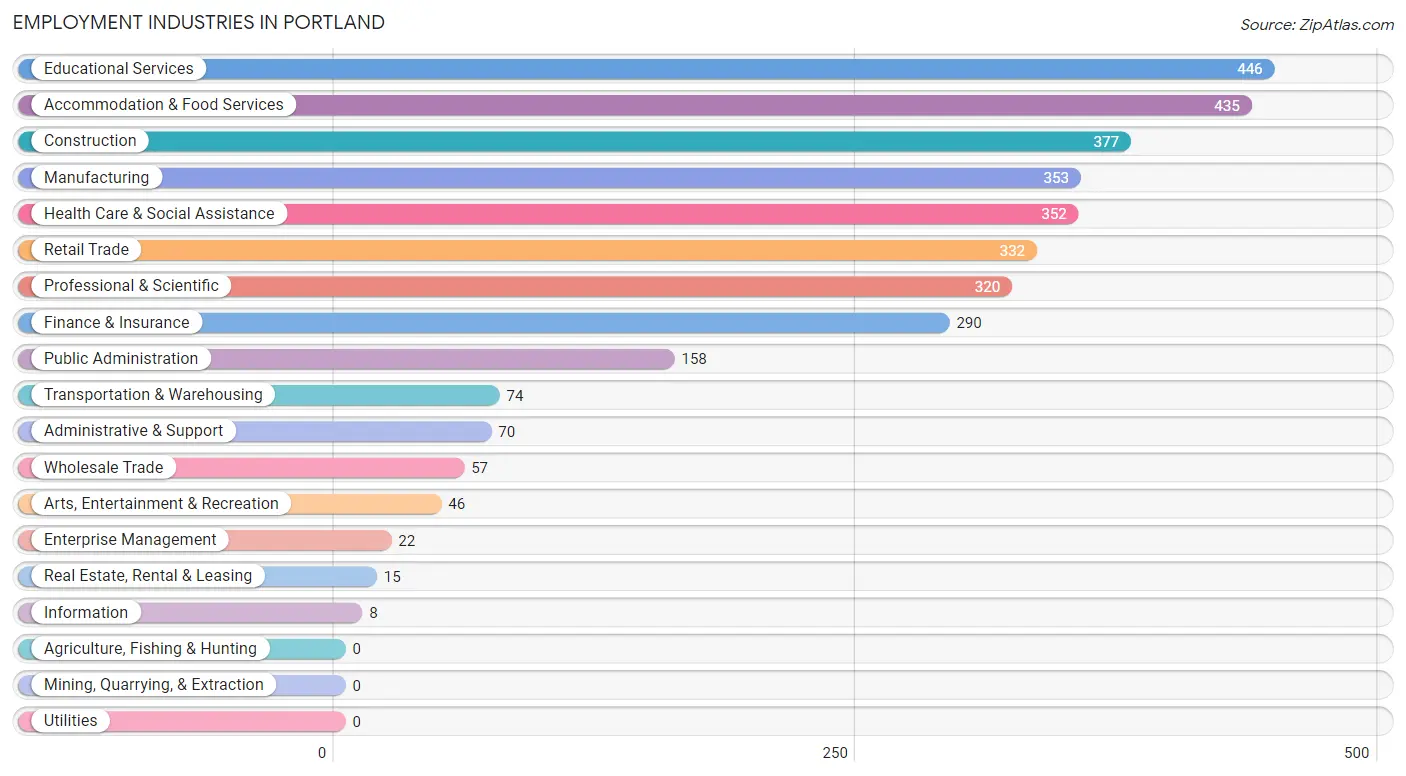
Employment Industries in Portland
The major employment industries in Portland include Educational Services (446 | 12.6%), Accommodation & Food Services (435 | 12.3%), Construction (377 | 10.7%), Manufacturing (353 | 10.0%), and Health Care & Social Assistance (352 | 10.0%).
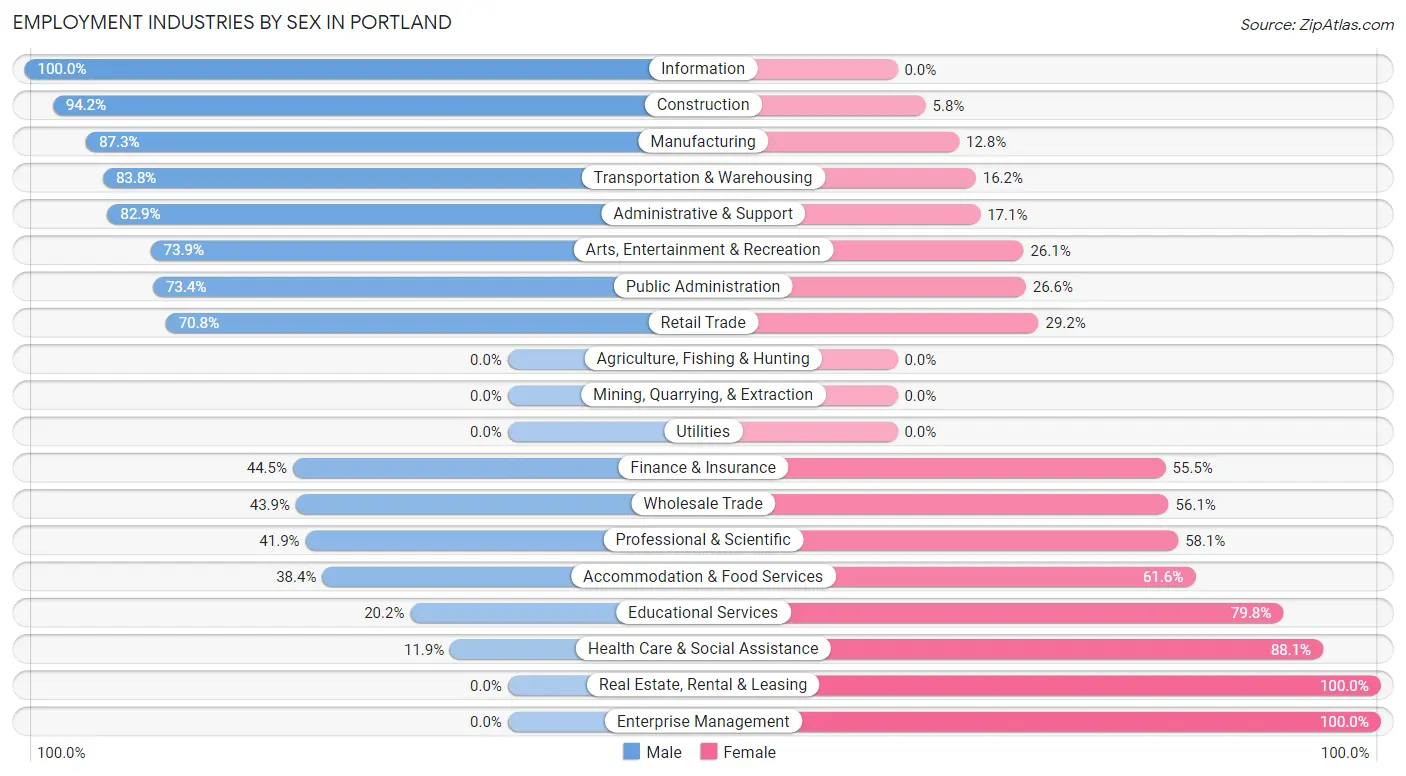
Employment Industries by Sex in Portland
The Portland industries that see more men than women are Information (100.0%), Construction (94.2%), and Manufacturing (87.3%), whereas the industries that tend to have a higher number of women are Real Estate, Rental & Leasing (100.0%), Enterprise Management (100.0%), and Health Care & Social Assistance (88.1%).
| Industry | Male | Female |
| Agriculture, Fishing & Hunting | 0 (0.0%) | 0 (0.0%) |
| Mining, Quarrying, & Extraction | 0 (0.0%) | 0 (0.0%) |
| Construction | 355 (94.2%) | 22 (5.8%) |
| Manufacturing | 308 (87.3%) | 45 (12.8%) |
| Wholesale Trade | 25 (43.9%) | 32 (56.1%) |
| Retail Trade | 235 (70.8%) | 97 (29.2%) |
| Transportation & Warehousing | 62 (83.8%) | 12 (16.2%) |
| Utilities | 0 (0.0%) | 0 (0.0%) |
| Information | 8 (100.0%) | 0 (0.0%) |
| Finance & Insurance | 129 (44.5%) | 161 (55.5%) |
| Real Estate, Rental & Leasing | 0 (0.0%) | 15 (100.0%) |
| Professional & Scientific | 134 (41.9%) | 186 (58.1%) |
| Enterprise Management | 0 (0.0%) | 22 (100.0%) |
| Administrative & Support | 58 (82.9%) | 12 (17.1%) |
| Educational Services | 90 (20.2%) | 356 (79.8%) |
| Health Care & Social Assistance | 42 (11.9%) | 310 (88.1%) |
| Arts, Entertainment & Recreation | 34 (73.9%) | 12 (26.1%) |
| Accommodation & Food Services | 167 (38.4%) | 268 (61.6%) |
| Public Administration | 116 (73.4%) | 42 (26.6%) |
| Total | 1,866 (52.8%) | 1,665 (47.1%) |
Education in Portland
School Enrollment in Portland
The most common levels of schooling among the 1,718 students in Portland are middle school (401 | 23.3%), college / undergraduate (394 | 22.9%), and elementary school (281 | 16.4%).
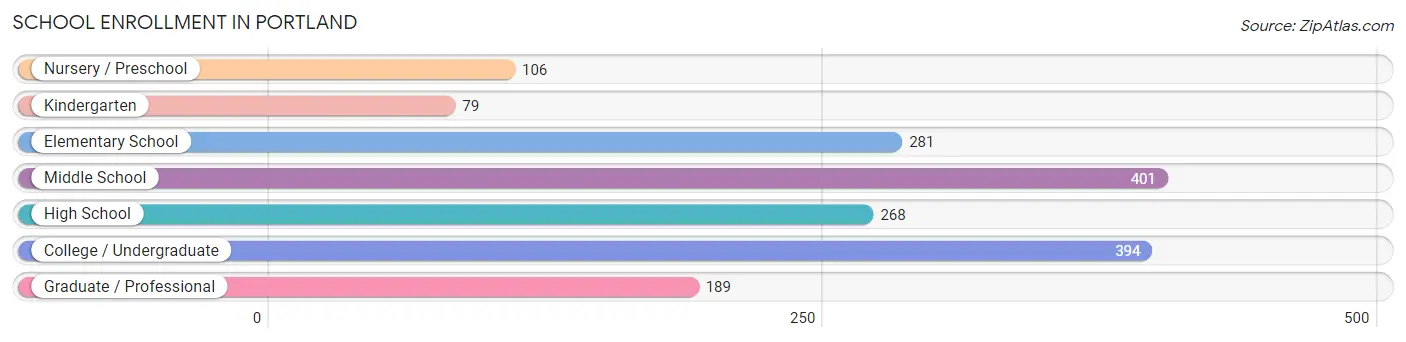
| School Level | # Students | % Students |
| Nursery / Preschool | 106 | 6.2% |
| Kindergarten | 79 | 4.6% |
| Elementary School | 281 | 16.4% |
| Middle School | 401 | 23.3% |
| High School | 268 | 15.6% |
| College / Undergraduate | 394 | 22.9% |
| Graduate / Professional | 189 | 11.0% |
| Total | 1,718 | 100.0% |
School Enrollment by Age by Funding Source in Portland
Out of a total of 1,718 students who are enrolled in schools in Portland, 234 (13.6%) attend a private institution, while the remaining 1,484 (86.4%) are enrolled in public schools. The age group of 3 to 4 year olds has the highest likelihood of being enrolled in private schools, with 69 (86.3% in the age bracket) enrolled. Conversely, the age group of 5 to 9 year old has the lowest likelihood of being enrolled in a private school, with 386 (100.0% in the age bracket) attending a public institution.
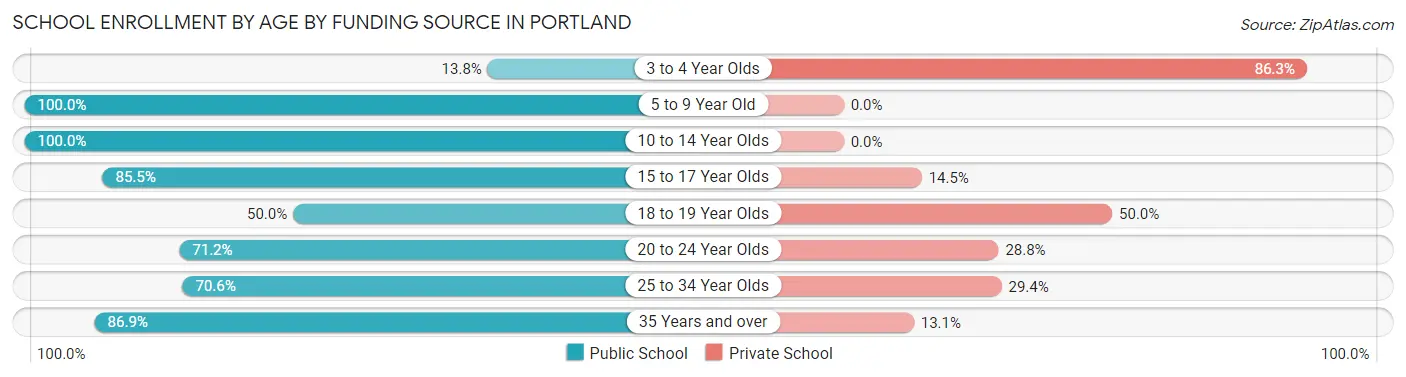
| Age Bracket | Public School | Private School |
| 3 to 4 Year Olds | 11 (13.8%) | 69 (86.3%) |
| 5 to 9 Year Old | 386 (100.0%) | 0 (0.0%) |
| 10 to 14 Year Olds | 424 (100.0%) | 0 (0.0%) |
| 15 to 17 Year Olds | 200 (85.5%) | 34 (14.5%) |
| 18 to 19 Year Olds | 11 (50.0%) | 11 (50.0%) |
| 20 to 24 Year Olds | 79 (71.2%) | 32 (28.8%) |
| 25 to 34 Year Olds | 120 (70.6%) | 50 (29.4%) |
| 35 Years and over | 253 (86.9%) | 38 (13.1%) |
| Total | 1,484 (86.4%) | 234 (13.6%) |
Educational Attainment by Field of Study in Portland
Business (415 | 21.3%), education (297 | 15.2%), communications (208 | 10.7%), visual & performing arts (163 | 8.4%), and social sciences (131 | 6.7%) are the most common fields of study among 1,950 individuals in Portland who have obtained a bachelor's degree or higher.
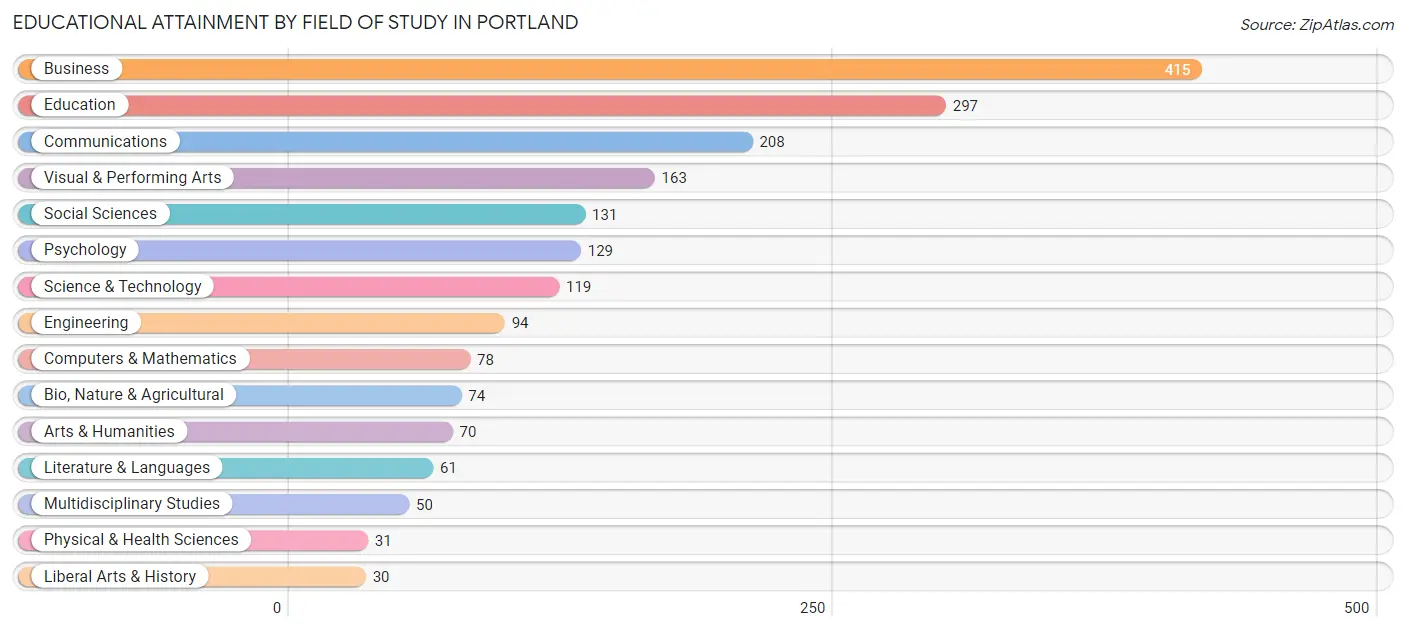
| Field of Study | # Graduates | % Graduates |
| Computers & Mathematics | 78 | 4.0% |
| Bio, Nature & Agricultural | 74 | 3.8% |
| Physical & Health Sciences | 31 | 1.6% |
| Psychology | 129 | 6.6% |
| Social Sciences | 131 | 6.7% |
| Engineering | 94 | 4.8% |
| Multidisciplinary Studies | 50 | 2.6% |
| Science & Technology | 119 | 6.1% |
| Business | 415 | 21.3% |
| Education | 297 | 15.2% |
| Literature & Languages | 61 | 3.1% |
| Liberal Arts & History | 30 | 1.5% |
| Visual & Performing Arts | 163 | 8.4% |
| Communications | 208 | 10.7% |
| Arts & Humanities | 70 | 3.6% |
| Total | 1,950 | 100.0% |
Transportation & Commute in Portland
Vehicle Availability by Sex in Portland
The most prevalent vehicle ownership categories in Portland are males with 2 vehicles (1,029, accounting for 56.5%) and females with 2 vehicles (974, making up 62.1%).
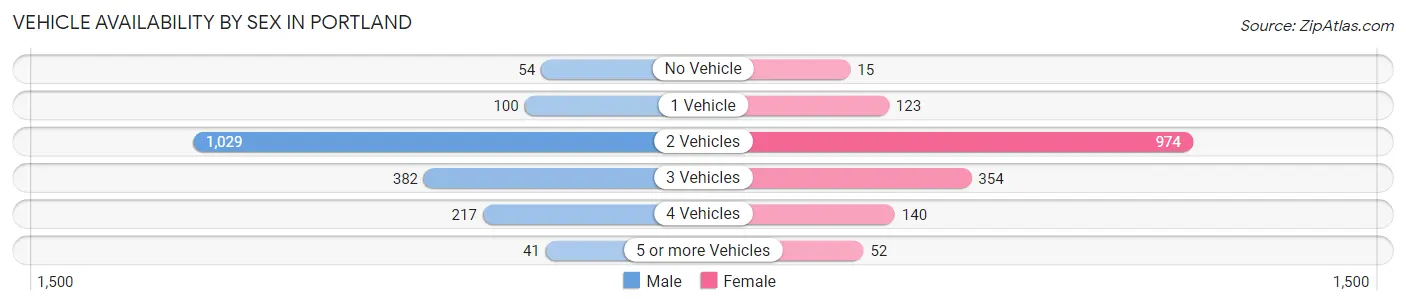
| Vehicles Available | Male | Female |
| No Vehicle | 54 (3.0%) | 15 (0.9%) |
| 1 Vehicle | 100 (5.5%) | 123 (7.4%) |
| 2 Vehicles | 1,029 (56.5%) | 974 (58.8%) |
| 3 Vehicles | 382 (20.9%) | 354 (21.3%) |
| 4 Vehicles | 217 (11.9%) | 140 (8.4%) |
| 5 or more Vehicles | 41 (2.2%) | 52 (3.1%) |
| Total | 1,823 (100.0%) | 1,658 (100.0%) |
Commute Time in Portland
The most frequently occuring commute durations in Portland are 45 to 59 minutes (606 commuters, 20.4%), 15 to 19 minutes (470 commuters, 15.9%), and 30 to 34 minutes (414 commuters, 14.0%).
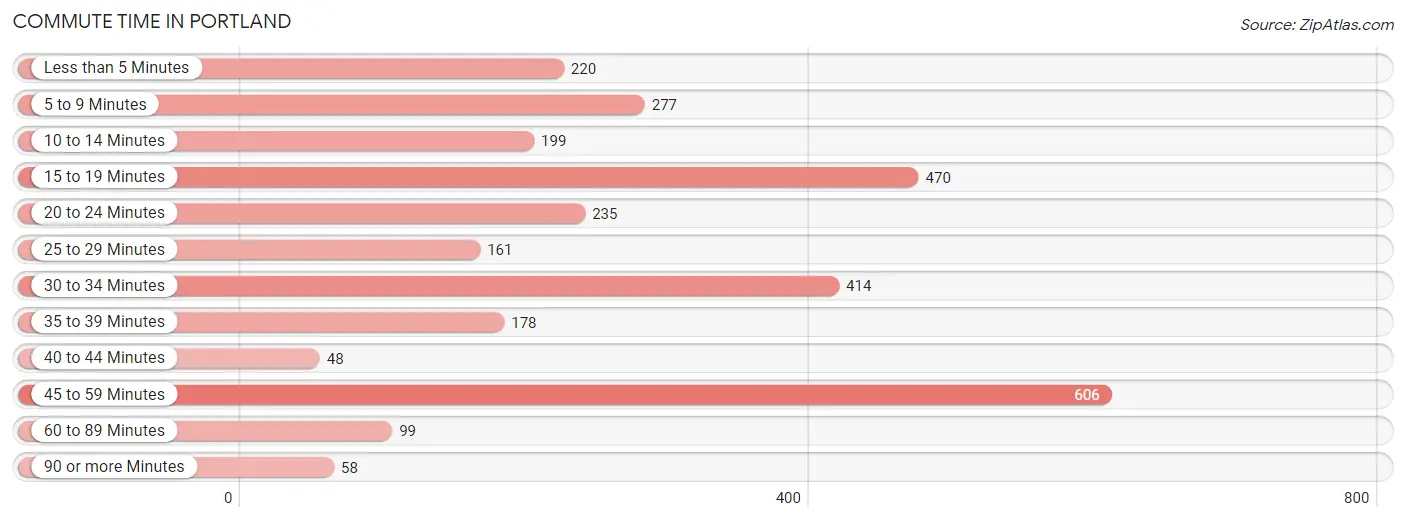
| Commute Time | # Commuters | % Commuters |
| Less than 5 Minutes | 220 | 7.4% |
| 5 to 9 Minutes | 277 | 9.3% |
| 10 to 14 Minutes | 199 | 6.7% |
| 15 to 19 Minutes | 470 | 15.9% |
| 20 to 24 Minutes | 235 | 7.9% |
| 25 to 29 Minutes | 161 | 5.4% |
| 30 to 34 Minutes | 414 | 14.0% |
| 35 to 39 Minutes | 178 | 6.0% |
| 40 to 44 Minutes | 48 | 1.6% |
| 45 to 59 Minutes | 606 | 20.4% |
| 60 to 89 Minutes | 99 | 3.3% |
| 90 or more Minutes | 58 | 2.0% |
Commute Time by Sex in Portland
The most common commute times in Portland are 15 to 19 minutes (284 commuters, 17.7%) for males and 45 to 59 minutes (334 commuters, 24.6%) for females.
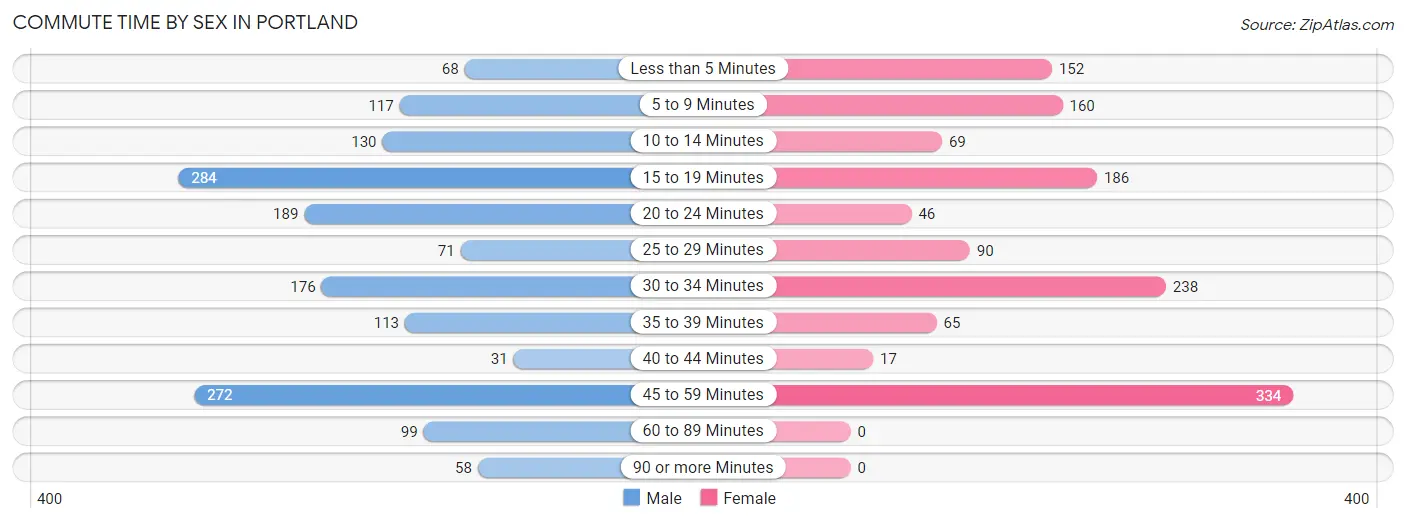
| Commute Time | Male | Female |
| Less than 5 Minutes | 68 (4.2%) | 152 (11.2%) |
| 5 to 9 Minutes | 117 (7.3%) | 160 (11.8%) |
| 10 to 14 Minutes | 130 (8.1%) | 69 (5.1%) |
| 15 to 19 Minutes | 284 (17.7%) | 186 (13.7%) |
| 20 to 24 Minutes | 189 (11.7%) | 46 (3.4%) |
| 25 to 29 Minutes | 71 (4.4%) | 90 (6.6%) |
| 30 to 34 Minutes | 176 (11.0%) | 238 (17.5%) |
| 35 to 39 Minutes | 113 (7.0%) | 65 (4.8%) |
| 40 to 44 Minutes | 31 (1.9%) | 17 (1.3%) |
| 45 to 59 Minutes | 272 (16.9%) | 334 (24.6%) |
| 60 to 89 Minutes | 99 (6.2%) | 0 (0.0%) |
| 90 or more Minutes | 58 (3.6%) | 0 (0.0%) |
Time of Departure to Work by Sex in Portland
The most frequent times of departure to work in Portland are 5:30 AM to 5:59 AM (227, 14.1%) for males and 8:00 AM to 8:29 AM (271, 20.0%) for females.
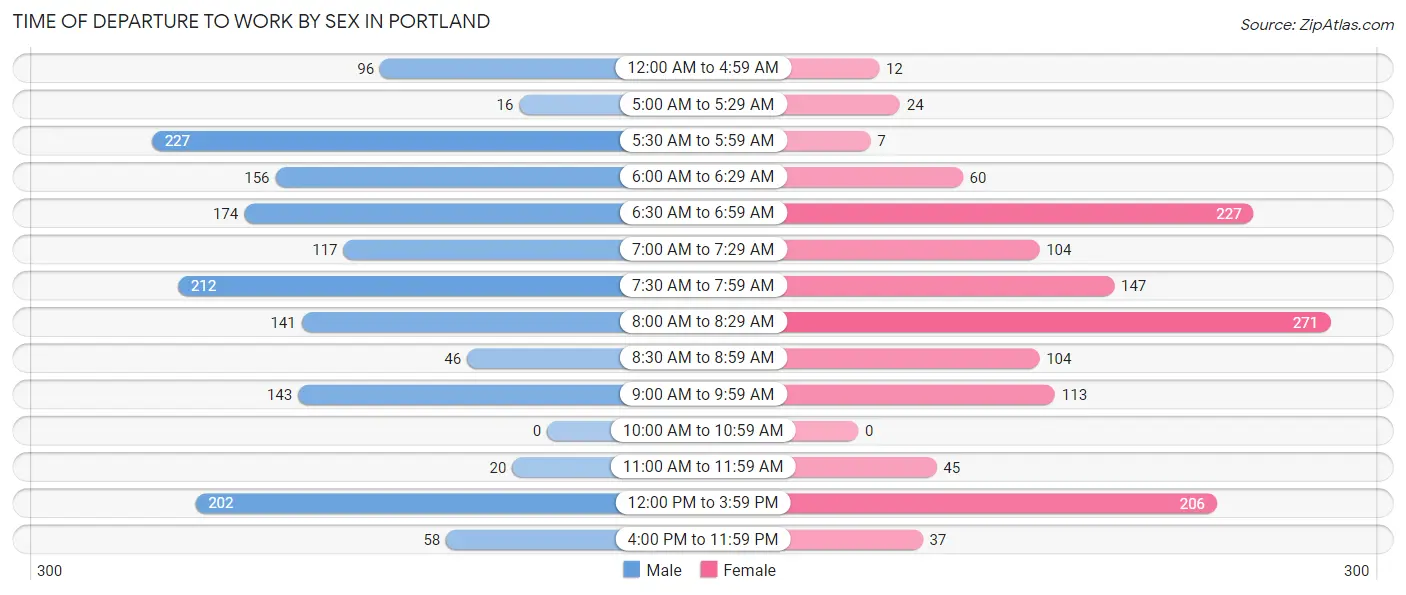
| Time of Departure | Male | Female |
| 12:00 AM to 4:59 AM | 96 (6.0%) | 12 (0.9%) |
| 5:00 AM to 5:29 AM | 16 (1.0%) | 24 (1.8%) |
| 5:30 AM to 5:59 AM | 227 (14.1%) | 7 (0.5%) |
| 6:00 AM to 6:29 AM | 156 (9.7%) | 60 (4.4%) |
| 6:30 AM to 6:59 AM | 174 (10.8%) | 227 (16.7%) |
| 7:00 AM to 7:29 AM | 117 (7.3%) | 104 (7.7%) |
| 7:30 AM to 7:59 AM | 212 (13.2%) | 147 (10.8%) |
| 8:00 AM to 8:29 AM | 141 (8.8%) | 271 (20.0%) |
| 8:30 AM to 8:59 AM | 46 (2.9%) | 104 (7.7%) |
| 9:00 AM to 9:59 AM | 143 (8.9%) | 113 (8.3%) |
| 10:00 AM to 10:59 AM | 0 (0.0%) | 0 (0.0%) |
| 11:00 AM to 11:59 AM | 20 (1.2%) | 45 (3.3%) |
| 12:00 PM to 3:59 PM | 202 (12.6%) | 206 (15.2%) |
| 4:00 PM to 11:59 PM | 58 (3.6%) | 37 (2.7%) |
| Total | 1,608 (100.0%) | 1,357 (100.0%) |
Housing Occupancy in Portland
Occupancy by Ownership in Portland
Of the total 2,502 dwellings in Portland, owner-occupied units account for 1,921 (76.8%), while renter-occupied units make up 581 (23.2%).
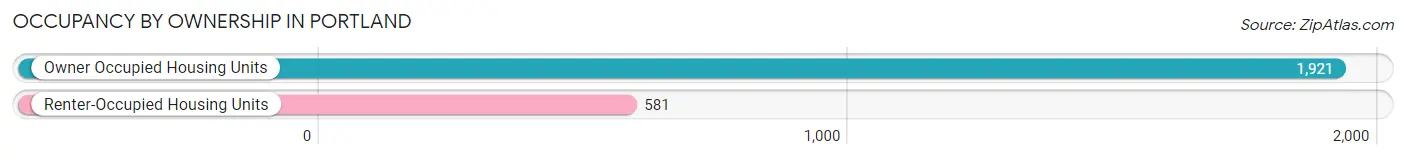
| Occupancy | # Housing Units | % Housing Units |
| Owner Occupied Housing Units | 1,921 | 76.8% |
| Renter-Occupied Housing Units | 581 | 23.2% |
| Total Occupied Housing Units | 2,502 | 100.0% |
Occupancy by Household Size in Portland
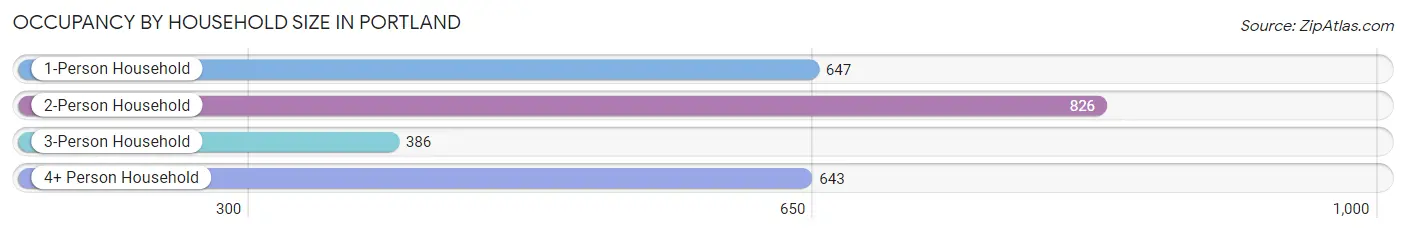
| Household Size | # Housing Units | % Housing Units |
| 1-Person Household | 647 | 25.9% |
| 2-Person Household | 826 | 33.0% |
| 3-Person Household | 386 | 15.4% |
| 4+ Person Household | 643 | 25.7% |
| Total Housing Units | 2,502 | 100.0% |
Occupancy by Ownership by Household Size in Portland
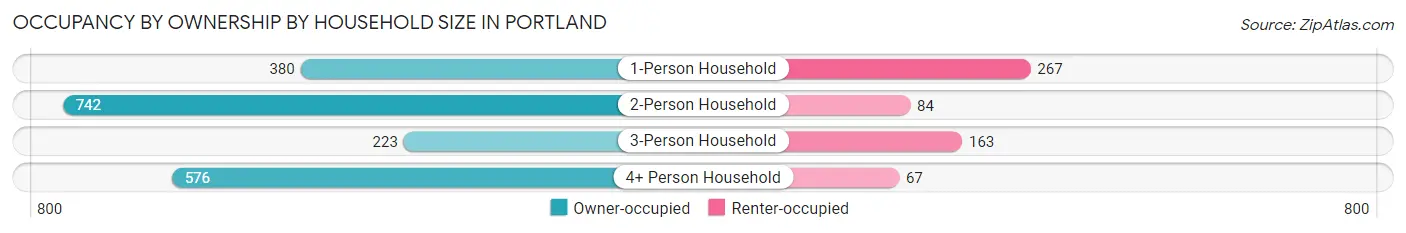
| Household Size | Owner-occupied | Renter-occupied |
| 1-Person Household | 380 (58.7%) | 267 (41.3%) |
| 2-Person Household | 742 (89.8%) | 84 (10.2%) |
| 3-Person Household | 223 (57.8%) | 163 (42.2%) |
| 4+ Person Household | 576 (89.6%) | 67 (10.4%) |
| Total Housing Units | 1,921 (76.8%) | 581 (23.2%) |
Occupancy by Educational Attainment in Portland
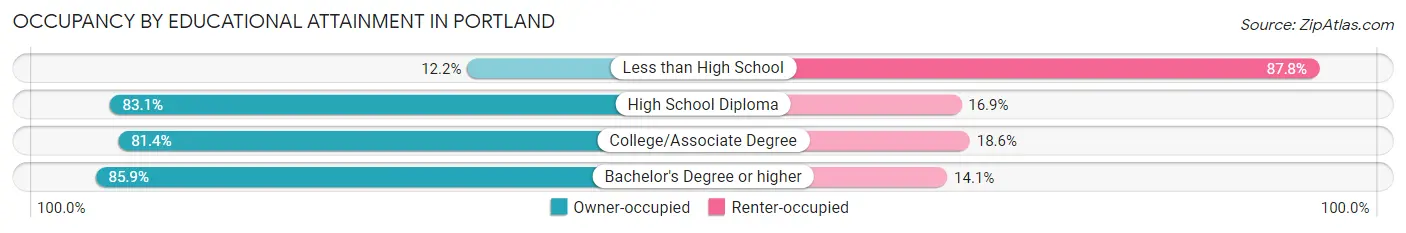
| Household Size | Owner-occupied | Renter-occupied |
| Less than High School | 30 (12.2%) | 215 (87.8%) |
| High School Diploma | 409 (83.1%) | 83 (16.9%) |
| College/Associate Degree | 627 (81.4%) | 143 (18.6%) |
| Bachelor's Degree or higher | 855 (85.9%) | 140 (14.1%) |
Occupancy by Age of Householder in Portland
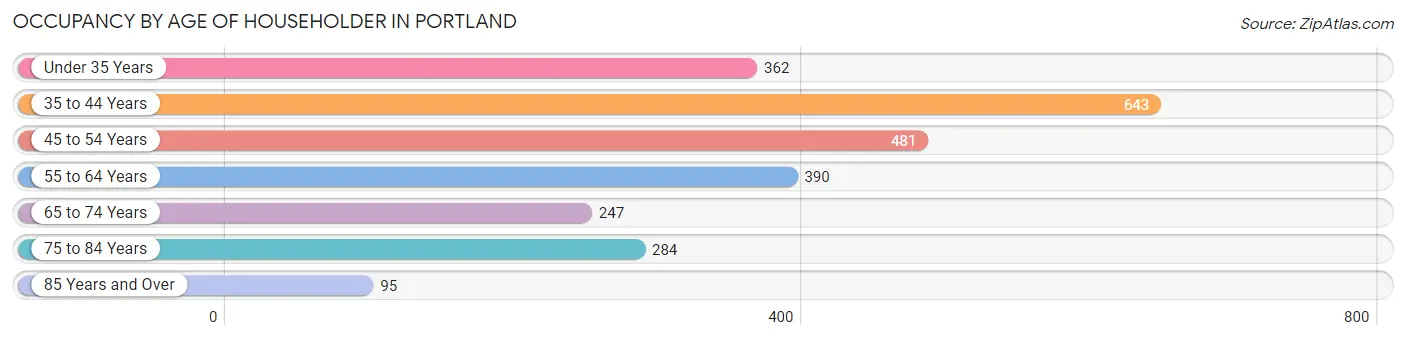
| Age Bracket | # Households | % Households |
| Under 35 Years | 362 | 14.5% |
| 35 to 44 Years | 643 | 25.7% |
| 45 to 54 Years | 481 | 19.2% |
| 55 to 64 Years | 390 | 15.6% |
| 65 to 74 Years | 247 | 9.9% |
| 75 to 84 Years | 284 | 11.4% |
| 85 Years and Over | 95 | 3.8% |
| Total | 2,502 | 100.0% |
Housing Finances in Portland
Median Income by Occupancy in Portland
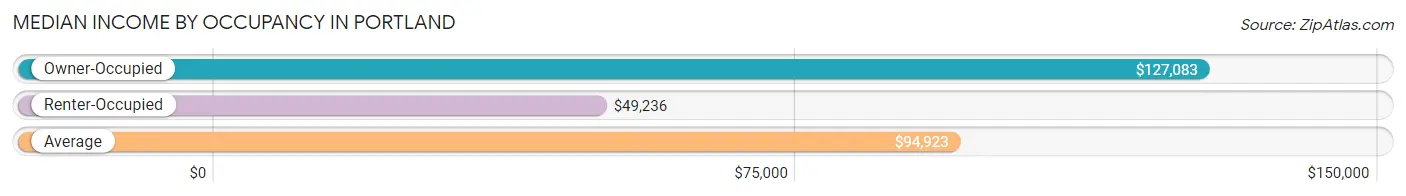
| Occupancy Type | # Households | Median Income |
| Owner-Occupied | 1,921 (76.8%) | $127,083 |
| Renter-Occupied | 581 (23.2%) | $49,236 |
| Average | 2,502 (100.0%) | $94,923 |
Occupancy by Householder Income Bracket in Portland
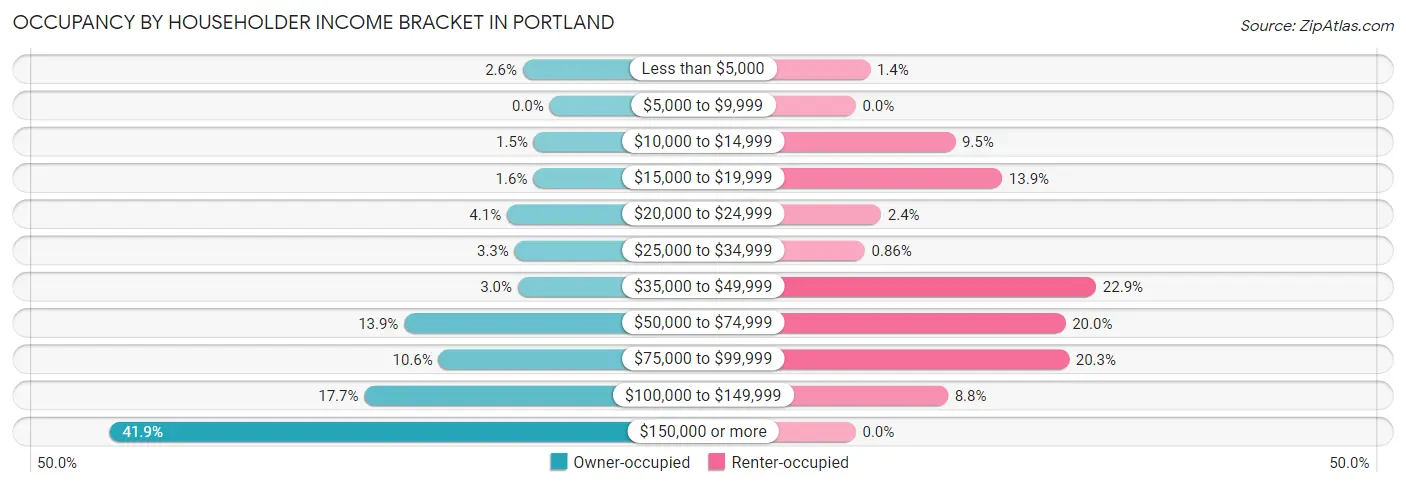
| Income Bracket | Owner-occupied | Renter-occupied |
| Less than $5,000 | 49 (2.5%) | 8 (1.4%) |
| $5,000 to $9,999 | 0 (0.0%) | 0 (0.0%) |
| $10,000 to $14,999 | 29 (1.5%) | 55 (9.5%) |
| $15,000 to $19,999 | 30 (1.6%) | 81 (13.9%) |
| $20,000 to $24,999 | 78 (4.1%) | 14 (2.4%) |
| $25,000 to $34,999 | 64 (3.3%) | 5 (0.9%) |
| $35,000 to $49,999 | 58 (3.0%) | 133 (22.9%) |
| $50,000 to $74,999 | 266 (13.9%) | 116 (20.0%) |
| $75,000 to $99,999 | 203 (10.6%) | 118 (20.3%) |
| $100,000 to $149,999 | 339 (17.6%) | 51 (8.8%) |
| $150,000 or more | 805 (41.9%) | 0 (0.0%) |
| Total | 1,921 (100.0%) | 581 (100.0%) |
Monthly Housing Cost Tiers in Portland
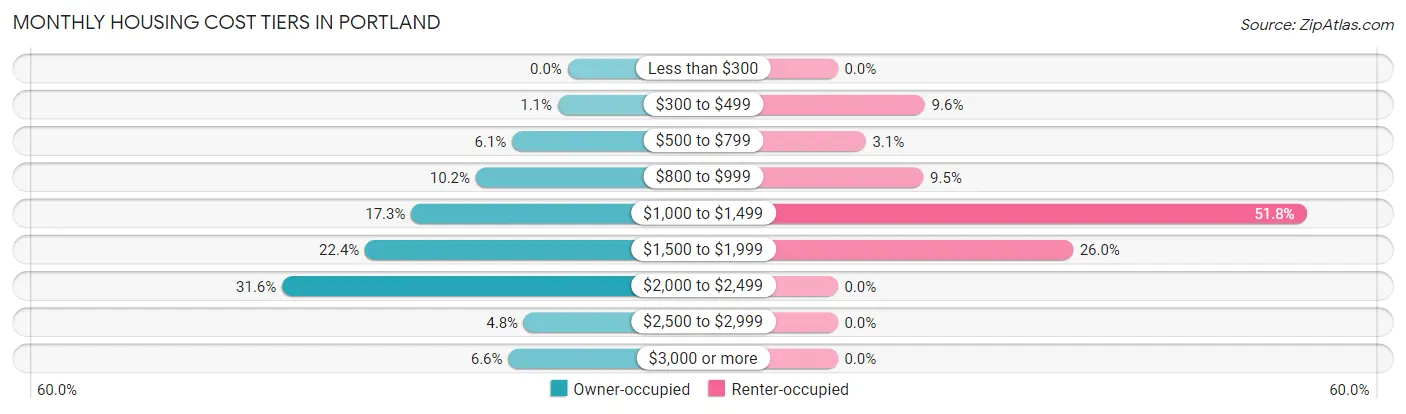
| Monthly Cost | Owner-occupied | Renter-occupied |
| Less than $300 | 0 (0.0%) | 0 (0.0%) |
| $300 to $499 | 21 (1.1%) | 56 (9.6%) |
| $500 to $799 | 118 (6.1%) | 18 (3.1%) |
| $800 to $999 | 195 (10.2%) | 55 (9.5%) |
| $1,000 to $1,499 | 332 (17.3%) | 301 (51.8%) |
| $1,500 to $1,999 | 430 (22.4%) | 151 (26.0%) |
| $2,000 to $2,499 | 606 (31.6%) | 0 (0.0%) |
| $2,500 to $2,999 | 93 (4.8%) | 0 (0.0%) |
| $3,000 or more | 126 (6.6%) | 0 (0.0%) |
| Total | 1,921 (100.0%) | 581 (100.0%) |
Physical Housing Characteristics in Portland
Housing Structures in Portland
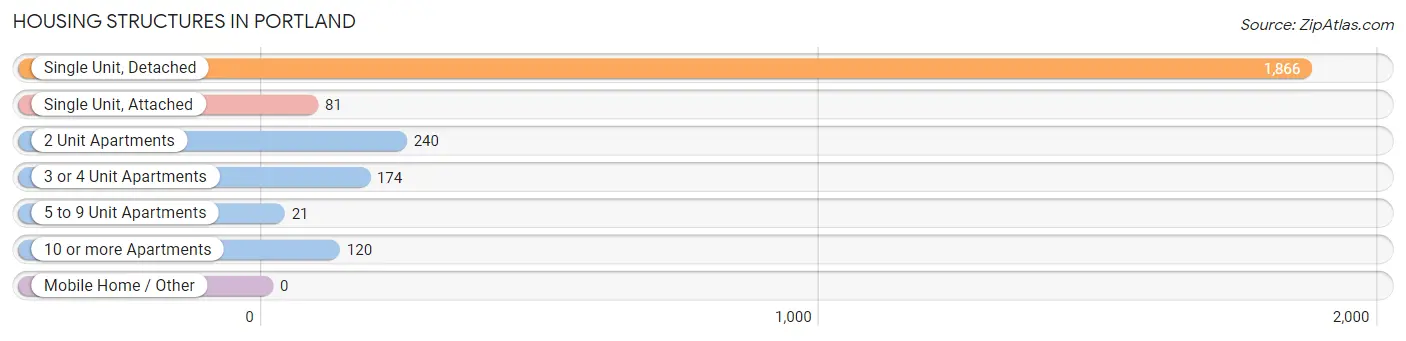
| Structure Type | # Housing Units | % Housing Units |
| Single Unit, Detached | 1,866 | 74.6% |
| Single Unit, Attached | 81 | 3.2% |
| 2 Unit Apartments | 240 | 9.6% |
| 3 or 4 Unit Apartments | 174 | 7.0% |
| 5 to 9 Unit Apartments | 21 | 0.8% |
| 10 or more Apartments | 120 | 4.8% |
| Mobile Home / Other | 0 | 0.0% |
| Total | 2,502 | 100.0% |
Housing Structures by Occupancy in Portland
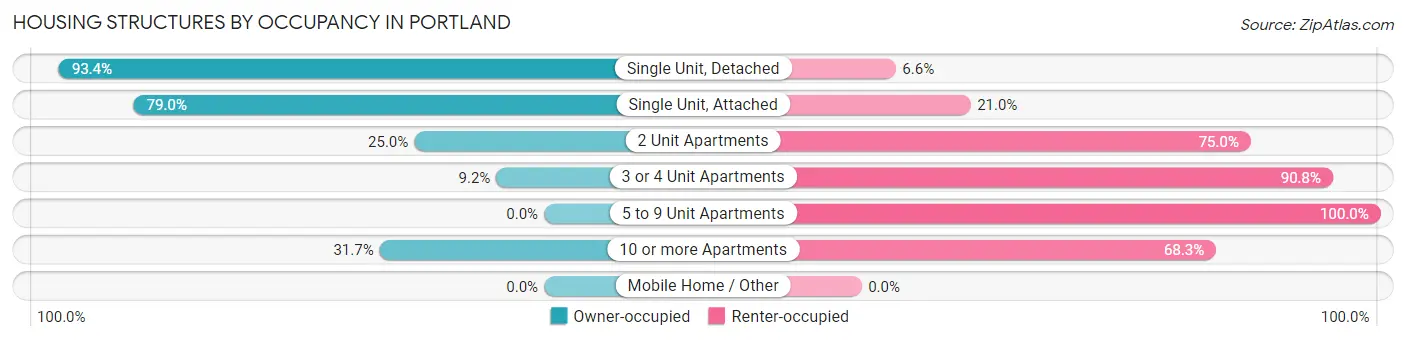
| Structure Type | Owner-occupied | Renter-occupied |
| Single Unit, Detached | 1,743 (93.4%) | 123 (6.6%) |
| Single Unit, Attached | 64 (79.0%) | 17 (21.0%) |
| 2 Unit Apartments | 60 (25.0%) | 180 (75.0%) |
| 3 or 4 Unit Apartments | 16 (9.2%) | 158 (90.8%) |
| 5 to 9 Unit Apartments | 0 (0.0%) | 21 (100.0%) |
| 10 or more Apartments | 38 (31.7%) | 82 (68.3%) |
| Mobile Home / Other | 0 (0.0%) | 0 (0.0%) |
| Total | 1,921 (76.8%) | 581 (23.2%) |
Housing Structures by Number of Rooms in Portland
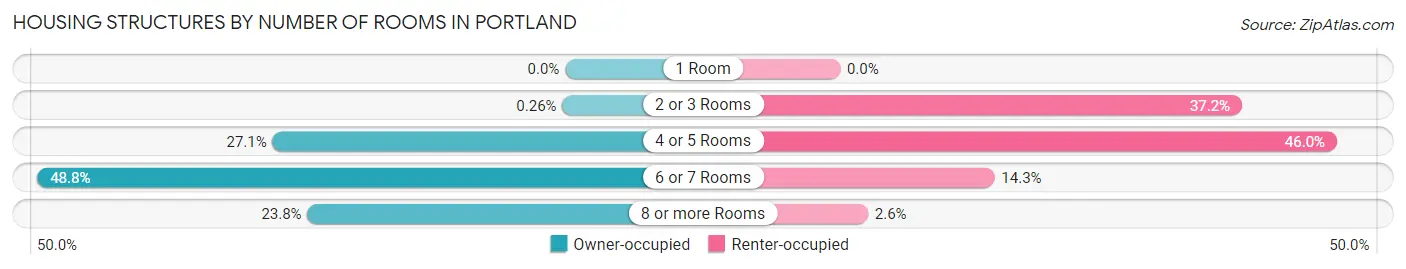
| Number of Rooms | Owner-occupied | Renter-occupied |
| 1 Room | 0 (0.0%) | 0 (0.0%) |
| 2 or 3 Rooms | 5 (0.3%) | 216 (37.2%) |
| 4 or 5 Rooms | 520 (27.1%) | 267 (46.0%) |
| 6 or 7 Rooms | 938 (48.8%) | 83 (14.3%) |
| 8 or more Rooms | 458 (23.8%) | 15 (2.6%) |
| Total | 1,921 (100.0%) | 581 (100.0%) |
Housing Structure by Heating Type in Portland
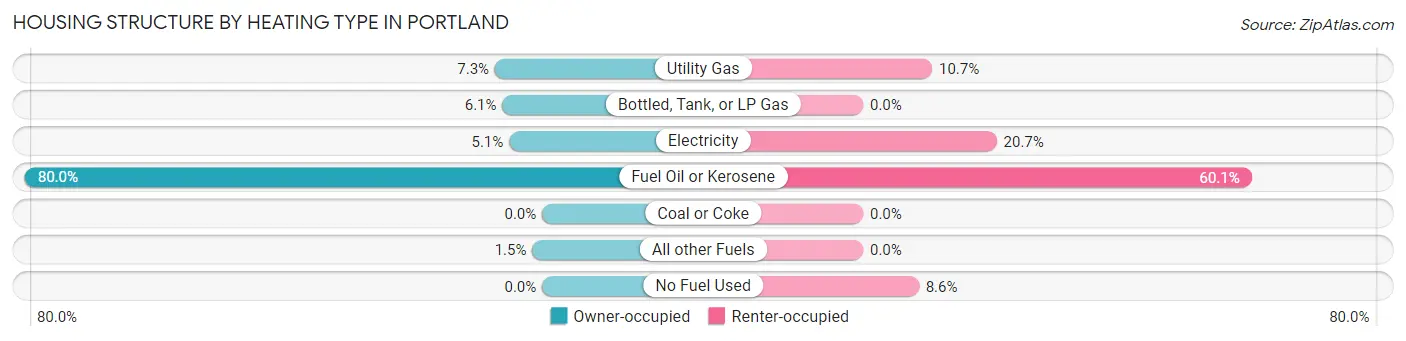
| Heating Type | Owner-occupied | Renter-occupied |
| Utility Gas | 140 (7.3%) | 62 (10.7%) |
| Bottled, Tank, or LP Gas | 118 (6.1%) | 0 (0.0%) |
| Electricity | 98 (5.1%) | 120 (20.6%) |
| Fuel Oil or Kerosene | 1,536 (80.0%) | 349 (60.1%) |
| Coal or Coke | 0 (0.0%) | 0 (0.0%) |
| All other Fuels | 29 (1.5%) | 0 (0.0%) |
| No Fuel Used | 0 (0.0%) | 50 (8.6%) |
| Total | 1,921 (100.0%) | 581 (100.0%) |
Household Vehicle Usage in Portland
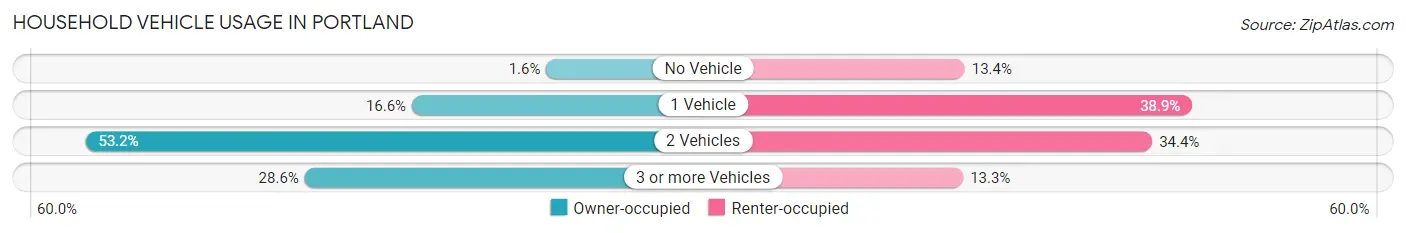
| Vehicles per Household | Owner-occupied | Renter-occupied |
| No Vehicle | 30 (1.6%) | 78 (13.4%) |
| 1 Vehicle | 319 (16.6%) | 226 (38.9%) |
| 2 Vehicles | 1,022 (53.2%) | 200 (34.4%) |
| 3 or more Vehicles | 550 (28.6%) | 77 (13.3%) |
| Total | 1,921 (100.0%) | 581 (100.0%) |
Real Estate & Mortgages in Portland
Real Estate and Mortgage Overview in Portland
| Characteristic | Without Mortgage | With Mortgage |
| Housing Units | 570 | 1,351 |
| Median Property Value | $261,500 | $254,100 |
| Median Household Income | $76,667 | $693 |
| Monthly Housing Costs | $917 | $126 |
| Real Estate Taxes | $5,706 | $11 |
Property Value by Mortgage Status in Portland
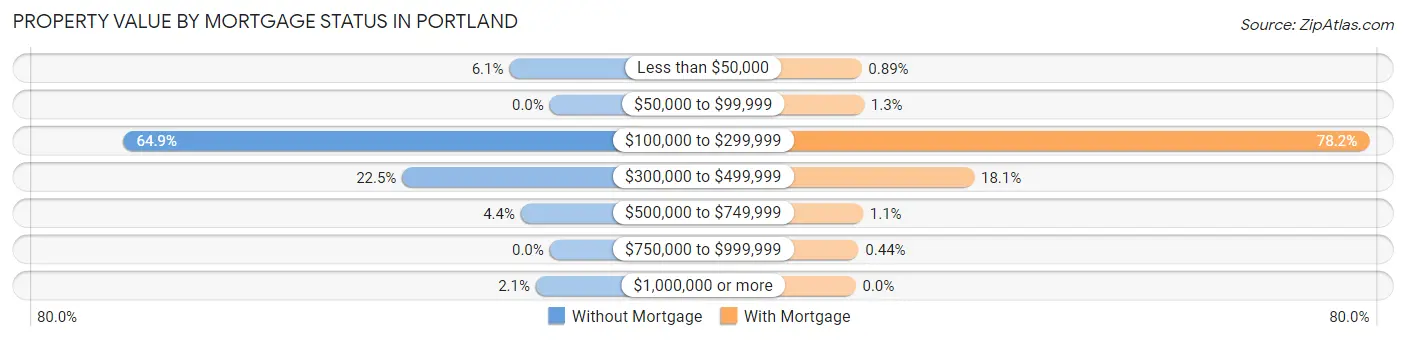
| Property Value | Without Mortgage | With Mortgage |
| Less than $50,000 | 35 (6.1%) | 12 (0.9%) |
| $50,000 to $99,999 | 0 (0.0%) | 17 (1.3%) |
| $100,000 to $299,999 | 370 (64.9%) | 1,057 (78.2%) |
| $300,000 to $499,999 | 128 (22.5%) | 244 (18.1%) |
| $500,000 to $749,999 | 25 (4.4%) | 15 (1.1%) |
| $750,000 to $999,999 | 0 (0.0%) | 6 (0.4%) |
| $1,000,000 or more | 12 (2.1%) | 0 (0.0%) |
| Total | 570 (100.0%) | 1,351 (100.0%) |
Household Income by Mortgage Status in Portland
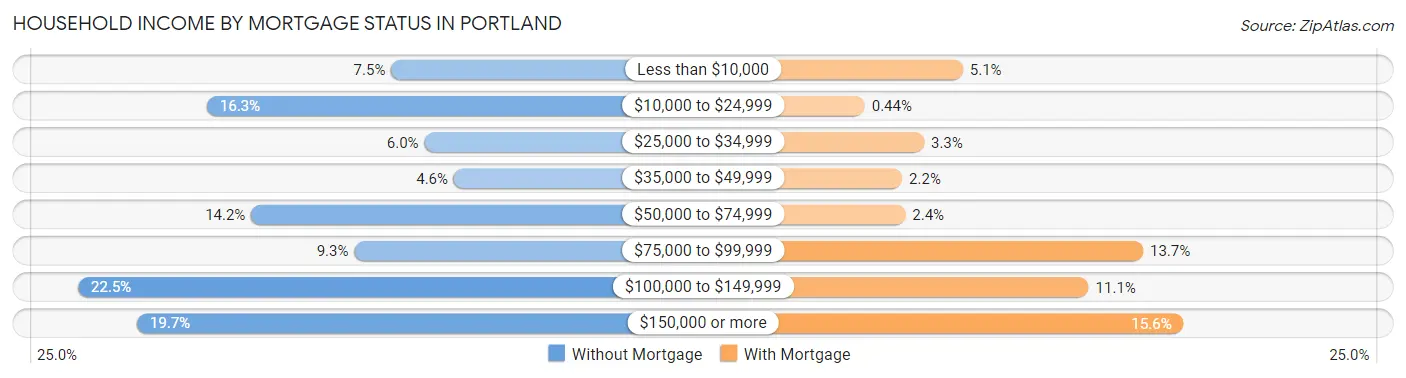
| Household Income | Without Mortgage | With Mortgage |
| Less than $10,000 | 43 (7.5%) | 69 (5.1%) |
| $10,000 to $24,999 | 93 (16.3%) | 6 (0.4%) |
| $25,000 to $34,999 | 34 (6.0%) | 44 (3.3%) |
| $35,000 to $49,999 | 26 (4.6%) | 30 (2.2%) |
| $50,000 to $74,999 | 81 (14.2%) | 32 (2.4%) |
| $75,000 to $99,999 | 53 (9.3%) | 185 (13.7%) |
| $100,000 to $149,999 | 128 (22.5%) | 150 (11.1%) |
| $150,000 or more | 112 (19.7%) | 211 (15.6%) |
| Total | 570 (100.0%) | 1,351 (100.0%) |
Property Value to Household Income Ratio in Portland
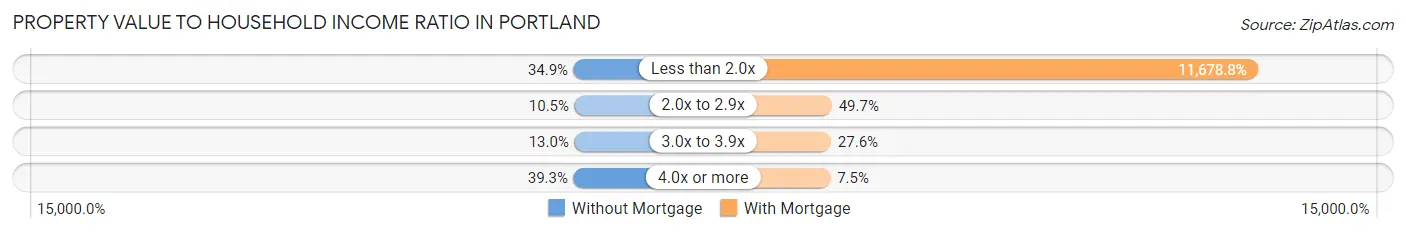
| Value-to-Income Ratio | Without Mortgage | With Mortgage |
| Less than 2.0x | 199 (34.9%) | 157,780 (11,678.8%) |
| 2.0x to 2.9x | 60 (10.5%) | 671 (49.7%) |
| 3.0x to 3.9x | 74 (13.0%) | 373 (27.6%) |
| 4.0x or more | 224 (39.3%) | 101 (7.5%) |
| Total | 570 (100.0%) | 1,351 (100.0%) |
Real Estate Taxes by Mortgage Status in Portland
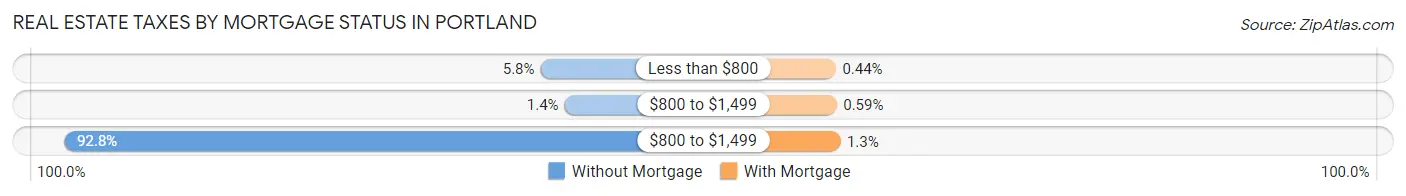
| Property Taxes | Without Mortgage | With Mortgage |
| Less than $800 | 33 (5.8%) | 6 (0.4%) |
| $800 to $1,499 | 8 (1.4%) | 8 (0.6%) |
| $800 to $1,499 | 529 (92.8%) | 17 (1.3%) |
| Total | 570 (100.0%) | 1,351 (100.0%) |
Health & Disability in Portland
Health Insurance Coverage by Age in Portland
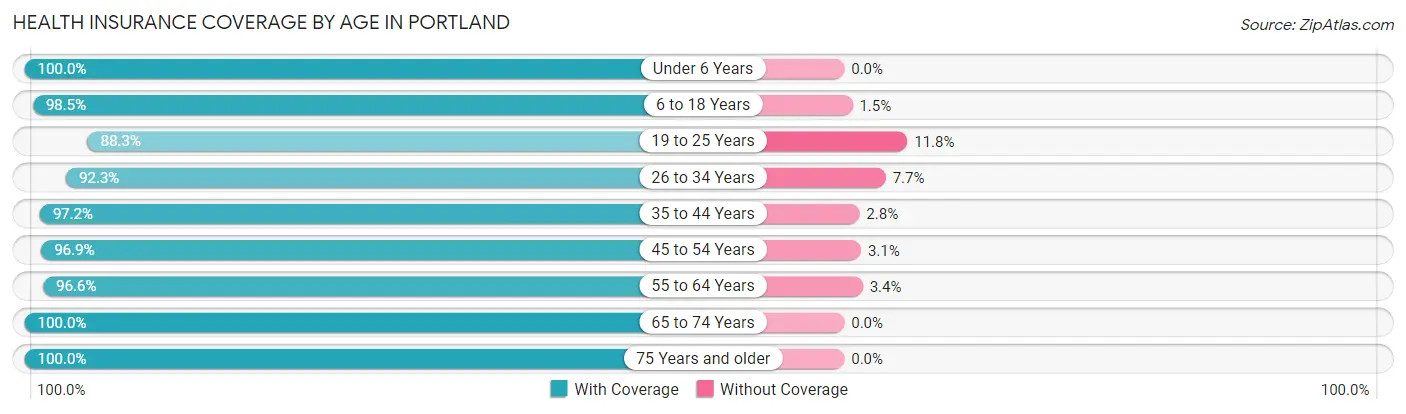
| Age Bracket | With Coverage | Without Coverage |
| Under 6 Years | 469 (100.0%) | 0 (0.0%) |
| 6 to 18 Years | 975 (98.5%) | 15 (1.5%) |
| 19 to 25 Years | 413 (88.2%) | 55 (11.7%) |
| 26 to 34 Years | 657 (92.3%) | 55 (7.7%) |
| 35 to 44 Years | 1,139 (97.2%) | 33 (2.8%) |
| 45 to 54 Years | 903 (96.9%) | 29 (3.1%) |
| 55 to 64 Years | 674 (96.6%) | 24 (3.4%) |
| 65 to 74 Years | 391 (100.0%) | 0 (0.0%) |
| 75 Years and older | 520 (100.0%) | 0 (0.0%) |
| Total | 6,141 (96.7%) | 211 (3.3%) |
Health Insurance Coverage by Citizenship Status in Portland
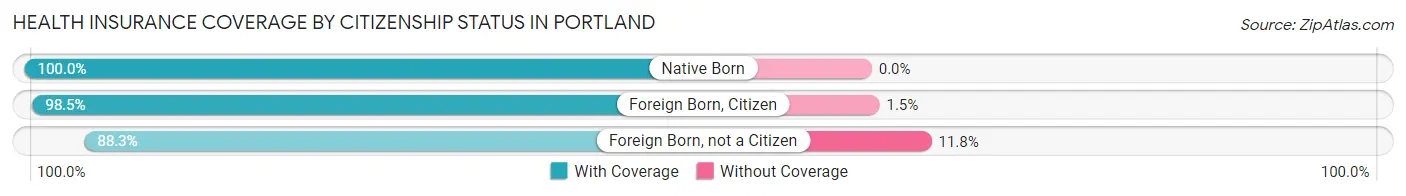
| Citizenship Status | With Coverage | Without Coverage |
| Native Born | 469 (100.0%) | 0 (0.0%) |
| Foreign Born, Citizen | 975 (98.5%) | 15 (1.5%) |
| Foreign Born, not a Citizen | 413 (88.2%) | 55 (11.7%) |
Health Insurance Coverage by Household Income in Portland
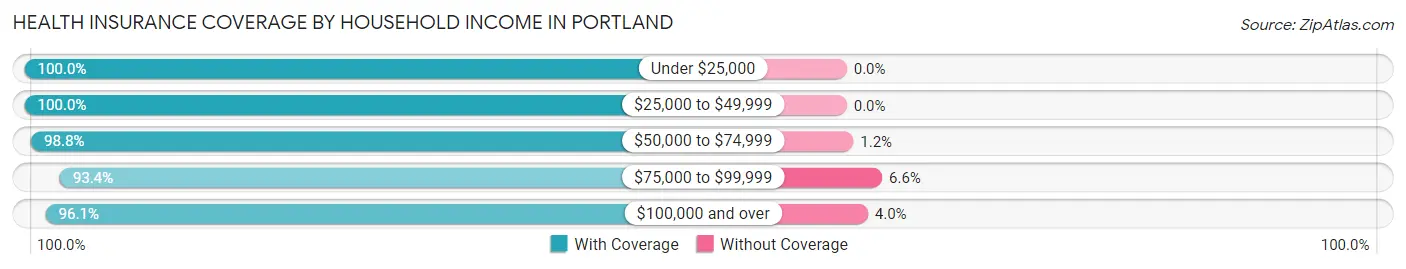
| Household Income | With Coverage | Without Coverage |
| Under $25,000 | 383 (100.0%) | 0 (0.0%) |
| $25,000 to $49,999 | 392 (100.0%) | 0 (0.0%) |
| $50,000 to $74,999 | 1,046 (98.8%) | 13 (1.2%) |
| $75,000 to $99,999 | 777 (93.4%) | 55 (6.6%) |
| $100,000 and over | 3,479 (96.1%) | 143 (4.0%) |
Public vs Private Health Insurance Coverage by Age in Portland
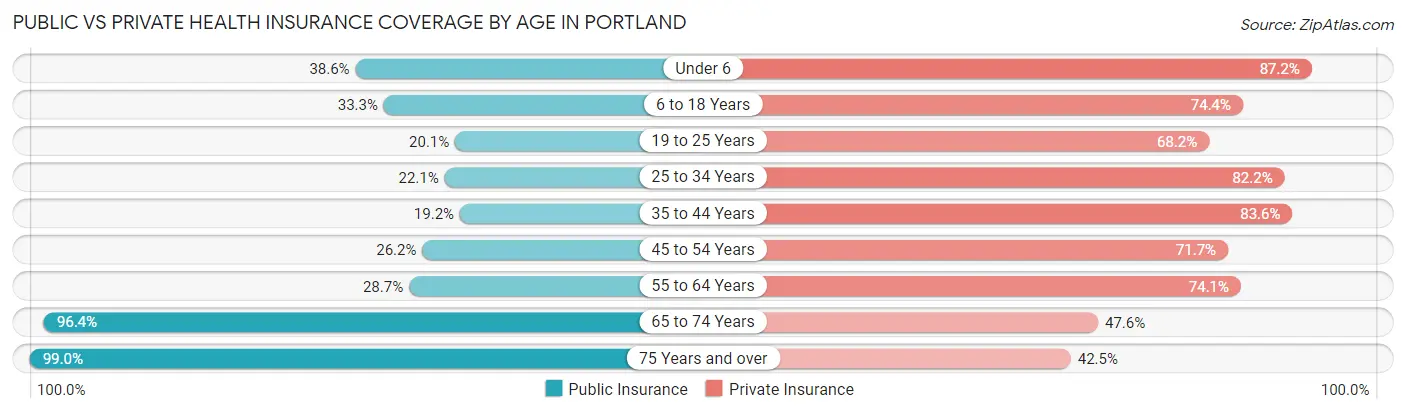
| Age Bracket | Public Insurance | Private Insurance |
| Under 6 | 181 (38.6%) | 409 (87.2%) |
| 6 to 18 Years | 330 (33.3%) | 737 (74.4%) |
| 19 to 25 Years | 94 (20.1%) | 319 (68.2%) |
| 25 to 34 Years | 157 (22.1%) | 585 (82.2%) |
| 35 to 44 Years | 225 (19.2%) | 980 (83.6%) |
| 45 to 54 Years | 244 (26.2%) | 668 (71.7%) |
| 55 to 64 Years | 200 (28.6%) | 517 (74.1%) |
| 65 to 74 Years | 377 (96.4%) | 186 (47.6%) |
| 75 Years and over | 515 (99.0%) | 221 (42.5%) |
| Total | 2,323 (36.6%) | 4,622 (72.8%) |
Disability Status by Sex by Age in Portland
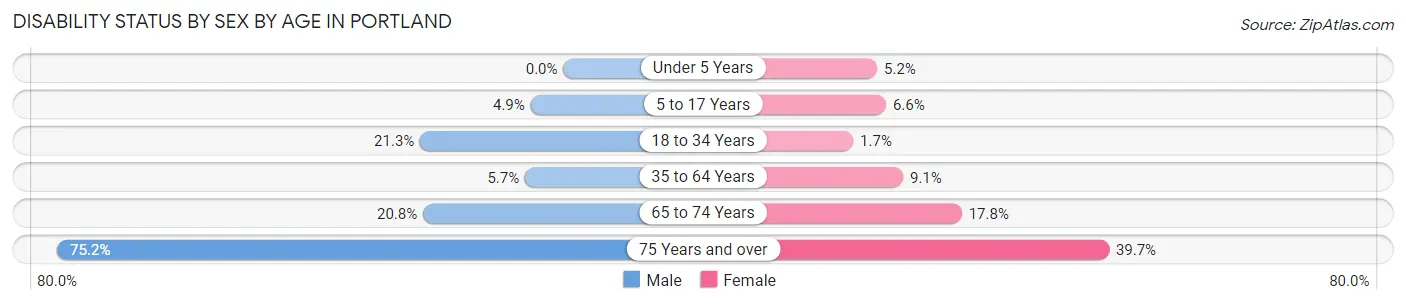
| Age Bracket | Male | Female |
| Under 5 Years | 0 (0.0%) | 10 (5.2%) |
| 5 to 17 Years | 27 (4.9%) | 32 (6.6%) |
| 18 to 34 Years | 118 (21.3%) | 11 (1.7%) |
| 35 to 64 Years | 85 (5.7%) | 119 (9.1%) |
| 65 to 74 Years | 30 (20.8%) | 44 (17.8%) |
| 75 Years and over | 209 (75.2%) | 96 (39.7%) |
Disability Class by Sex by Age in Portland
Disability Class: Hearing Difficulty
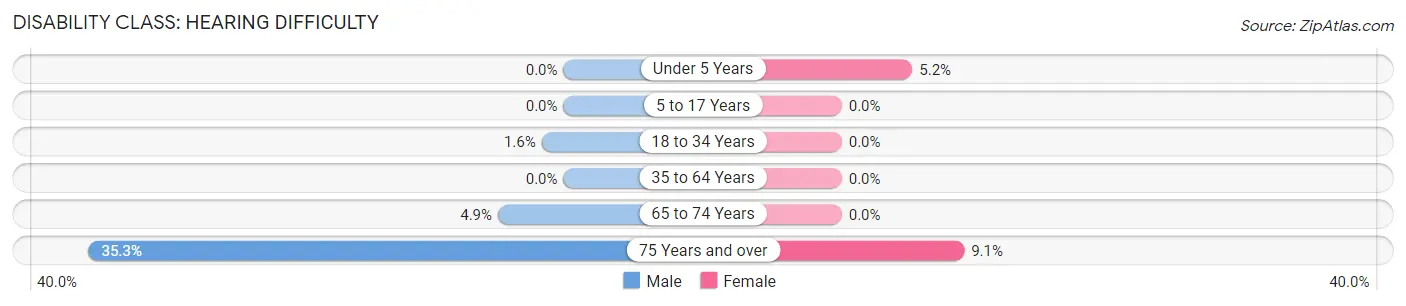
| Age Bracket | Male | Female |
| Under 5 Years | 0 (0.0%) | 10 (5.2%) |
| 5 to 17 Years | 0 (0.0%) | 0 (0.0%) |
| 18 to 34 Years | 9 (1.6%) | 0 (0.0%) |
| 35 to 64 Years | 0 (0.0%) | 0 (0.0%) |
| 65 to 74 Years | 7 (4.9%) | 0 (0.0%) |
| 75 Years and over | 98 (35.2%) | 22 (9.1%) |
Disability Class: Vision Difficulty
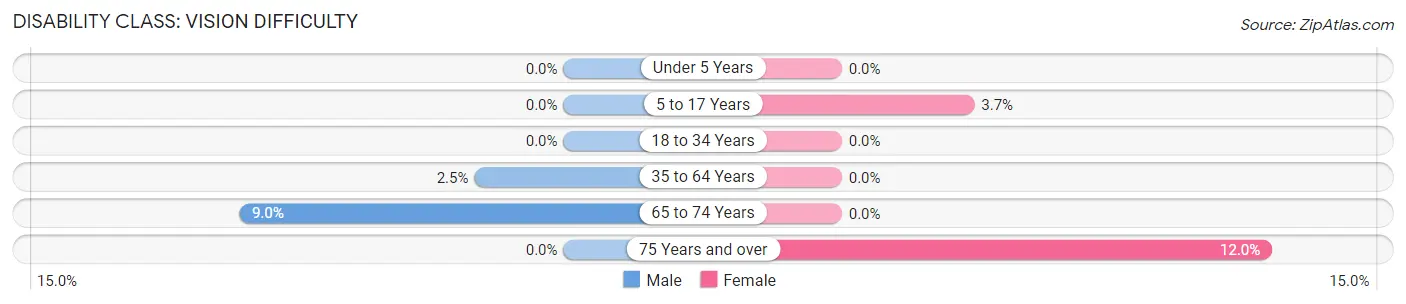
| Age Bracket | Male | Female |
| Under 5 Years | 0 (0.0%) | 0 (0.0%) |
| 5 to 17 Years | 0 (0.0%) | 18 (3.7%) |
| 18 to 34 Years | 0 (0.0%) | 0 (0.0%) |
| 35 to 64 Years | 37 (2.5%) | 0 (0.0%) |
| 65 to 74 Years | 13 (9.0%) | 0 (0.0%) |
| 75 Years and over | 0 (0.0%) | 29 (12.0%) |
Disability Class: Cognitive Difficulty
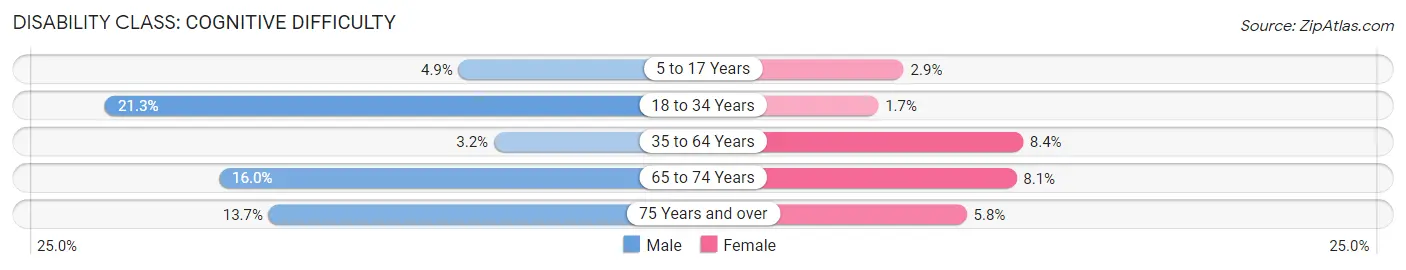
| Age Bracket | Male | Female |
| 5 to 17 Years | 27 (4.9%) | 14 (2.9%) |
| 18 to 34 Years | 118 (21.3%) | 11 (1.7%) |
| 35 to 64 Years | 48 (3.2%) | 110 (8.4%) |
| 65 to 74 Years | 23 (16.0%) | 20 (8.1%) |
| 75 Years and over | 38 (13.7%) | 14 (5.8%) |
Disability Class: Ambulatory Difficulty
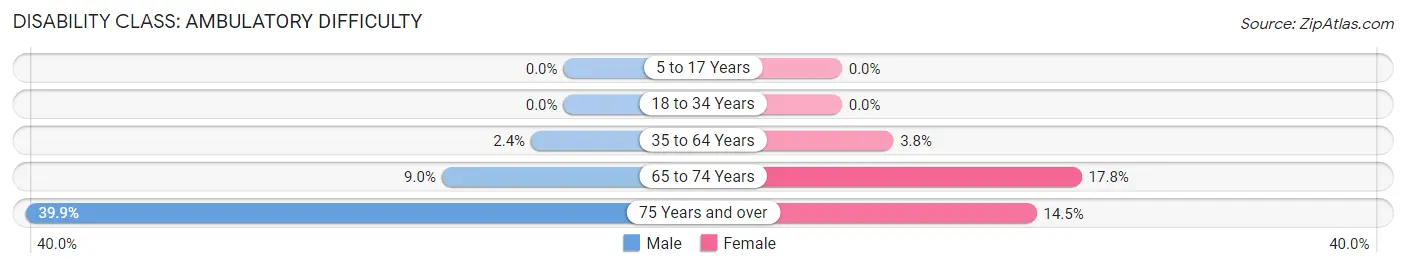
| Age Bracket | Male | Female |
| 5 to 17 Years | 0 (0.0%) | 0 (0.0%) |
| 18 to 34 Years | 0 (0.0%) | 0 (0.0%) |
| 35 to 64 Years | 36 (2.4%) | 50 (3.8%) |
| 65 to 74 Years | 13 (9.0%) | 44 (17.8%) |
| 75 Years and over | 111 (39.9%) | 35 (14.5%) |
Disability Class: Self-Care Difficulty
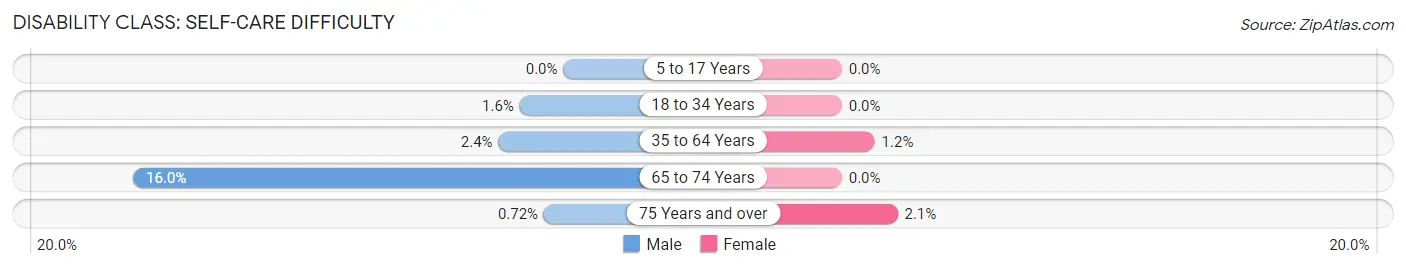
| Age Bracket | Male | Female |
| 5 to 17 Years | 0 (0.0%) | 0 (0.0%) |
| 18 to 34 Years | 9 (1.6%) | 0 (0.0%) |
| 35 to 64 Years | 36 (2.4%) | 16 (1.2%) |
| 65 to 74 Years | 23 (16.0%) | 0 (0.0%) |
| 75 Years and over | 2 (0.7%) | 5 (2.1%) |
Technology Access in Portland
Computing Device Access in Portland
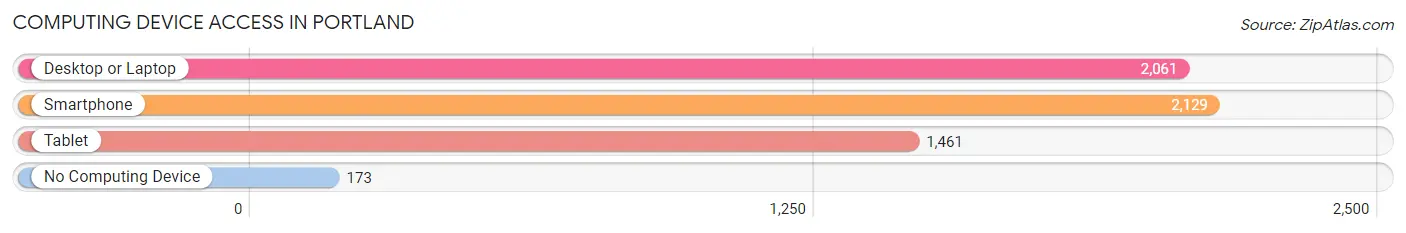
| Device Type | # Households | % Households |
| Desktop or Laptop | 2,061 | 82.4% |
| Smartphone | 2,129 | 85.1% |
| Tablet | 1,461 | 58.4% |
| No Computing Device | 173 | 6.9% |
| Total | 2,502 | 100.0% |
Internet Access in Portland
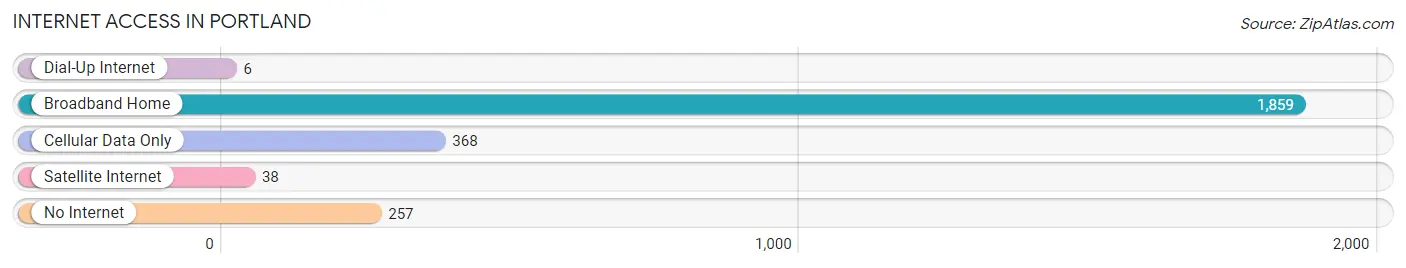
| Internet Type | # Households | % Households |
| Dial-Up Internet | 6 | 0.2% |
| Broadband Home | 1,859 | 74.3% |
| Cellular Data Only | 368 | 14.7% |
| Satellite Internet | 38 | 1.5% |
| No Internet | 257 | 10.3% |
| Total | 2,502 | 100.0% |
Portland Summary
Portland, Connecticut is a small town located in Middlesex County, Connecticut. It is situated on the Connecticut River, and is bordered by the towns of East Hampton, Middletown, Cromwell, and Glastonbury. The town has a population of 8,717 as of the 2010 census, and is part of the Greater Hartford metropolitan area.
History
The area that is now Portland was originally inhabited by the Wangunk Native American tribe. The first European settlers arrived in the area in 1690, and the town was officially incorporated in 1841. The town was named after Portland, Maine, which was named after the Isle of Portland in England.
The town was primarily an agricultural community until the mid-19th century, when the Connecticut River was used to transport goods and people. The town was also home to several mills, including a paper mill, a grist mill, and a saw mill.
Geography
Portland is located in central Connecticut, and is bordered by the towns of East Hampton, Middletown, Cromwell, and Glastonbury. The town has a total area of 16.3 square miles, of which 15.9 square miles is land and 0.4 square miles is water. The Connecticut River forms the western border of the town.
The terrain of Portland is mostly flat, with some rolling hills in the northern part of town. The highest point in the town is the summit of Brown Hill, which has an elevation of 590 feet.
Economy
The economy of Portland is largely based on manufacturing and services. The town is home to several manufacturing companies, including Pratt & Whitney, a manufacturer of aircraft engines, and the Portland Manufacturing Company, which produces industrial machinery.
The town is also home to several service-based businesses, including banks, insurance companies, and medical offices. The town is also home to several retail stores, restaurants, and other businesses.
Demographics
As of the 2010 census, there were 8,717 people, 3,521 households, and 2,323 families residing in the town. The population density was 548.2 people per square mile. The racial makeup of the town was 94.2% White, 1.7% African American, 0.3% Native American, 1.3% Asian, 0.1% Pacific Islander, 0.9% from other races, and 1.5% from two or more races. Hispanic or Latino of any race were 3.2% of the population.
The median income for a household in the town was $63,917, and the median income for a family was $76,917. The per capita income for the town was $30,917. About 4.2% of families and 5.7% of the population were below the poverty line, including 6.3% of those under age 18 and 4.2% of those age 65 or over.
Common Questions
What is Per Capita Income in Portland?
Per Capita income in Portland is $44,122.
What is the Median Family Income in Portland?
Median Family Income in Portland is $135,427.
What is the Median Household income in Portland?
Median Household Income in Portland is $94,923.
What is Income or Wage Gap in Portland?
Income or Wage Gap in Portland is 27.3%.
Women in Portland earn 72.7 cents for every dollar earned by a man.
What is Inequality or Gini Index in Portland?
Inequality or Gini Index in Portland is 0.39.
What is the Total Population of Portland?
Total Population of Portland is 6,417.
What is the Total Male Population of Portland?
Total Male Population of Portland is 3,238.
What is the Total Female Population of Portland?
Total Female Population of Portland is 3,179.
What is the Ratio of Males per 100 Females in Portland?
There are 101.86 Males per 100 Females in Portland.
What is the Ratio of Females per 100 Males in Portland?
There are 98.18 Females per 100 Males in Portland.
What is the Median Population Age in Portland?
Median Population Age in Portland is 38.9 Years.
What is the Average Family Size in Portland
Average Family Size in Portland is 3.0 People.
What is the Average Household Size in Portland
Average Household Size in Portland is 2.5 People.
How Large is the Labor Force in Portland?
There are 3,770 People in the Labor Forcein in Portland.
What is the Percentage of People in the Labor Force in Portland?
72.9% of People are in the Labor Force in Portland.
What is the Unemployment Rate in Portland?
Unemployment Rate in Portland is 6.3%.