Moosup, CT Map & Demographics
Moosup Map
Moosup Overview
$27,761
PER CAPITA INCOME
$66,613
AVG FAMILY INCOME
$64,466
AVG HOUSEHOLD INCOME
39.3%
WAGE / INCOME GAP [ % ]
60.7¢/ $1
WAGE / INCOME GAP [ $ ]
0.32
INEQUALITY / GINI INDEX
3,175
TOTAL POPULATION
1,582
MALE POPULATION
1,593
FEMALE POPULATION
99.31
MALES / 100 FEMALES
100.70
FEMALES / 100 MALES
30.8
MEDIAN AGE
2.7
AVG FAMILY SIZE
2.5
AVG HOUSEHOLD SIZE
1,832
LABOR FORCE [ PEOPLE ]
69.4%
PERCENT IN LABOR FORCE
6.8%
UNEMPLOYMENT RATE
Moosup Zip Codes
Moosup Area Codes
Income in Moosup
Income Overview in Moosup
Per Capita Income in Moosup is $27,761, while median incomes of families and households are $66,613 and $64,466 respectively.
| Characteristic | Number | Measure |
| Per Capita Income | 3,175 | $27,761 |
| Median Family Income | 996 | $66,613 |
| Mean Family Income | 996 | $71,192 |
| Median Household Income | 1,269 | $64,466 |
| Mean Household Income | 1,269 | $69,556 |
| Income Deficit | 996 | $0 |
| Wage / Income Gap (%) | 3,175 | 39.31% |
| Wage / Income Gap ($) | 3,175 | 60.69¢ per $1 |
| Gini / Inequality Index | 3,175 | 0.32 |
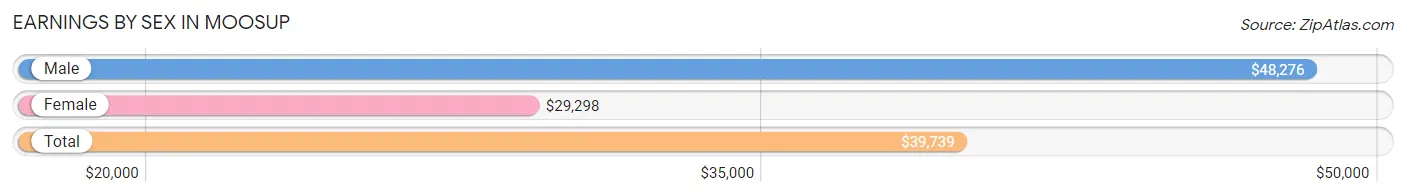
Earnings by Sex in Moosup
Average Earnings in Moosup are $39,739, $48,276 for men and $29,298 for women, a difference of 39.3%.
| Sex | Number | Average Earnings |
| Male | 968 (54.1%) | $48,276 |
| Female | 822 (45.9%) | $29,298 |
| Total | 1,790 (100.0%) | $39,739 |
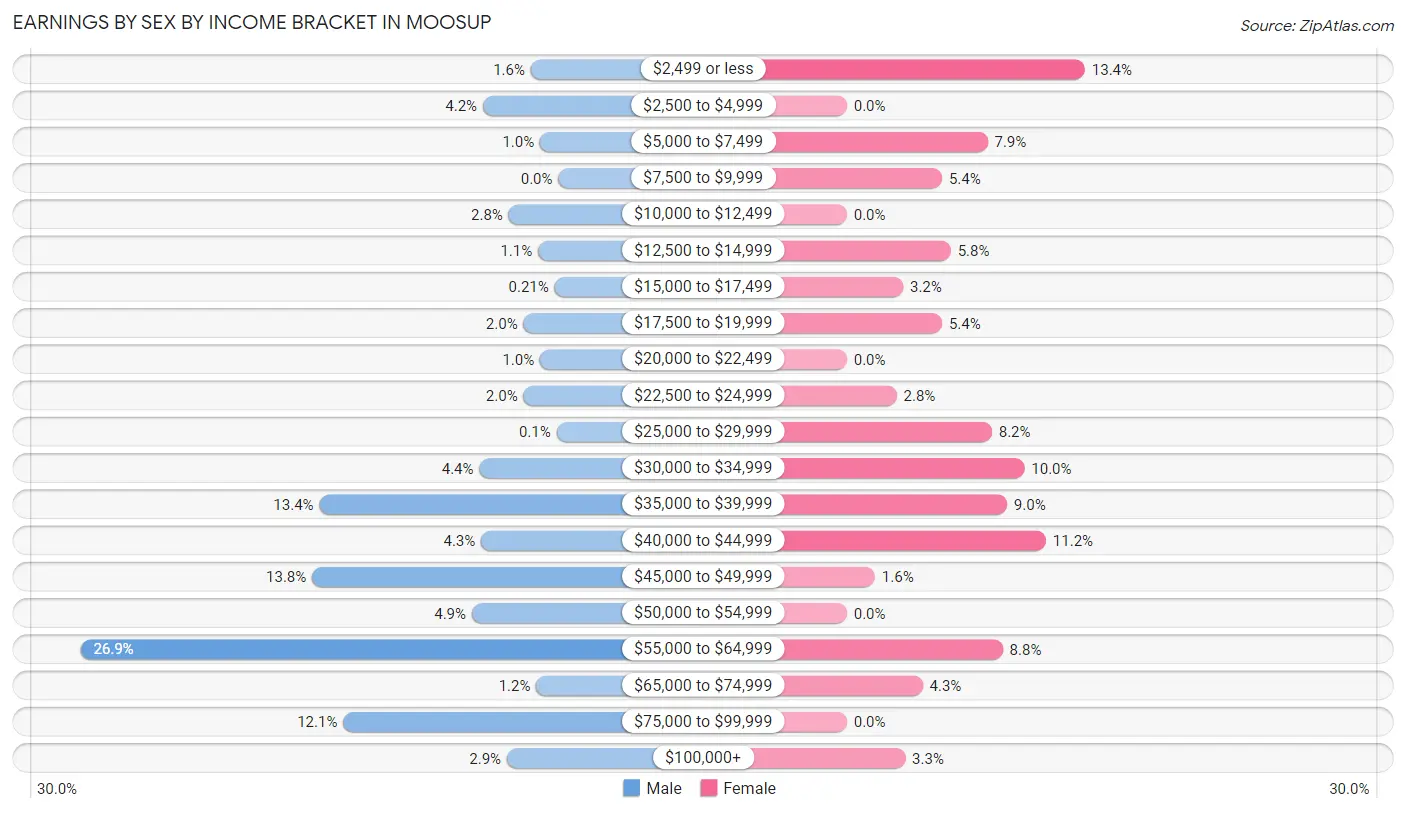
Earnings by Sex by Income Bracket in Moosup
The most common earnings brackets in Moosup are $55,000 to $64,999 for men (260 | 26.9%) and $2,499 or less for women (110 | 13.4%).
| Income | Male | Female |
| $2,499 or less | 15 (1.5%) | 110 (13.4%) |
| $2,500 to $4,999 | 41 (4.2%) | 0 (0.0%) |
| $5,000 to $7,499 | 10 (1.0%) | 65 (7.9%) |
| $7,500 to $9,999 | 0 (0.0%) | 44 (5.3%) |
| $10,000 to $12,499 | 27 (2.8%) | 0 (0.0%) |
| $12,500 to $14,999 | 11 (1.1%) | 48 (5.8%) |
| $15,000 to $17,499 | 2 (0.2%) | 26 (3.2%) |
| $17,500 to $19,999 | 19 (2.0%) | 44 (5.3%) |
| $20,000 to $22,499 | 10 (1.0%) | 0 (0.0%) |
| $22,500 to $24,999 | 19 (2.0%) | 23 (2.8%) |
| $25,000 to $29,999 | 1 (0.1%) | 67 (8.2%) |
| $30,000 to $34,999 | 43 (4.4%) | 82 (10.0%) |
| $35,000 to $39,999 | 130 (13.4%) | 74 (9.0%) |
| $40,000 to $44,999 | 42 (4.3%) | 92 (11.2%) |
| $45,000 to $49,999 | 134 (13.8%) | 13 (1.6%) |
| $50,000 to $54,999 | 47 (4.9%) | 0 (0.0%) |
| $55,000 to $64,999 | 260 (26.9%) | 72 (8.8%) |
| $65,000 to $74,999 | 12 (1.2%) | 35 (4.3%) |
| $75,000 to $99,999 | 117 (12.1%) | 0 (0.0%) |
| $100,000+ | 28 (2.9%) | 27 (3.3%) |
| Total | 968 (100.0%) | 822 (100.0%) |
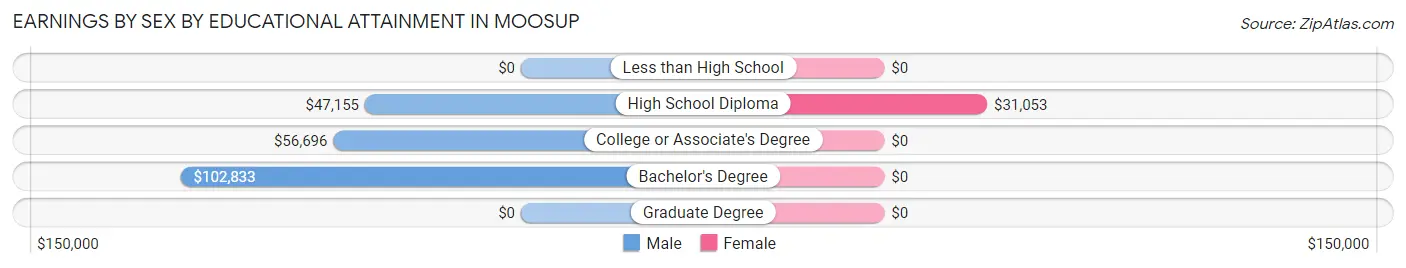
Earnings by Sex by Educational Attainment in Moosup
Average earnings in Moosup are $49,479 for men and $29,583 for women, a difference of 40.2%. Men with an educational attainment of bachelor's degree enjoy the highest average annual earnings of $102,833, while those with high school diploma education earn the least with $47,155. Women with an educational attainment of high school diploma earn the most with the average annual earnings of $31,053, while those with high school diploma education have the smallest earnings of $31,053.
| Educational Attainment | Male Income | Female Income |
| Less than High School | - | - |
| High School Diploma | $47,155 | $31,053 |
| College or Associate's Degree | $56,696 | $0 |
| Bachelor's Degree | $102,833 | $0 |
| Graduate Degree | - | - |
| Total | $49,479 | $29,583 |
Family Income in Moosup
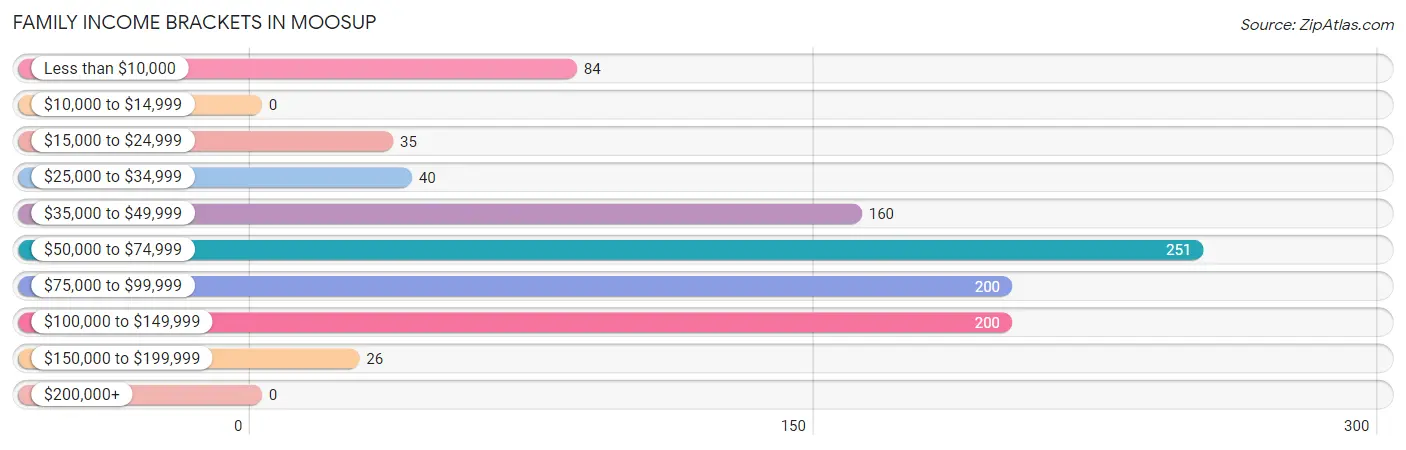
Family Income Brackets in Moosup
According to the Moosup family income data, there are 251 families falling into the $50,000 to $74,999 income range, which is the most common income bracket and makes up 25.2% of all families.
| Income Bracket | # Families | % Families |
| Less than $10,000 | 84 | 8.4% |
| $10,000 to $14,999 | 0 | 0.0% |
| $15,000 to $24,999 | 35 | 3.5% |
| $25,000 to $34,999 | 40 | 4.0% |
| $35,000 to $49,999 | 160 | 16.1% |
| $50,000 to $74,999 | 251 | 25.2% |
| $75,000 to $99,999 | 200 | 20.1% |
| $100,000 to $149,999 | 200 | 20.1% |
| $150,000 to $199,999 | 26 | 2.6% |
| $200,000+ | 0 | 0.0% |
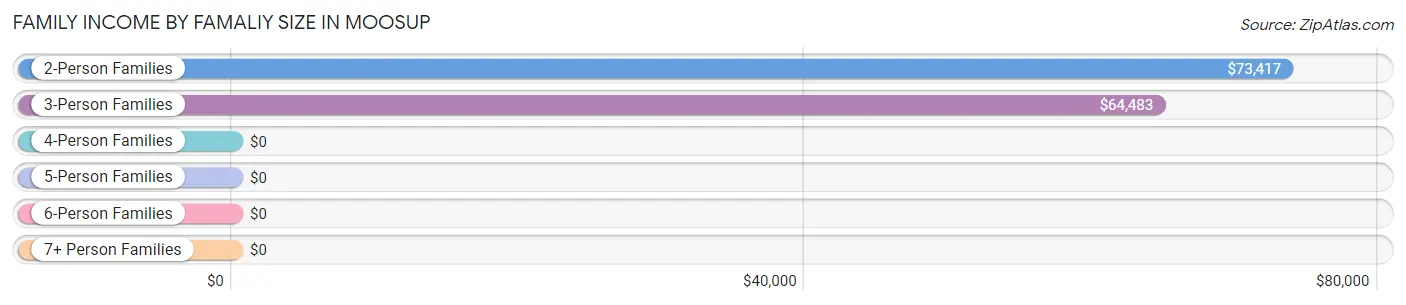
Family Income by Famaliy Size in Moosup
2-person families (504 | 50.6%) account for the highest median family income in Moosup with $73,417 per family, while 2-person families (504 | 50.6%) have the highest median income of $36,708 per family member.
| Income Bracket | # Families | Median Income |
| 2-Person Families | 504 (50.6%) | $73,417 |
| 3-Person Families | 314 (31.5%) | $64,483 |
| 4-Person Families | 134 (13.5%) | $0 |
| 5-Person Families | 13 (1.3%) | $0 |
| 6-Person Families | 31 (3.1%) | $0 |
| 7+ Person Families | 0 (0.0%) | $0 |
| Total | 996 (100.0%) | $66,613 |
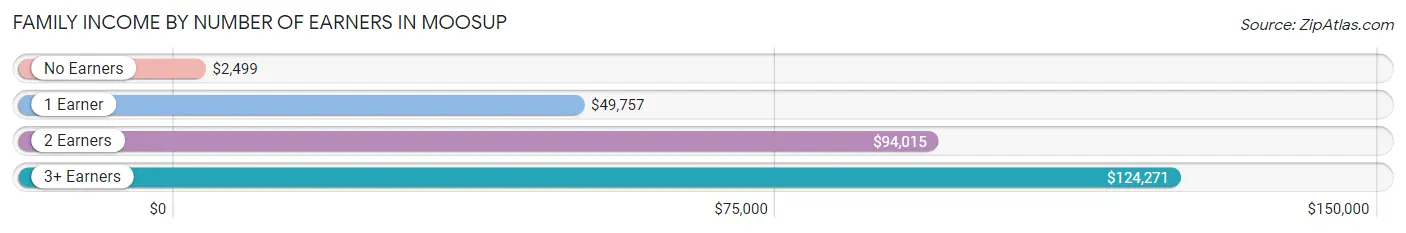
Family Income by Number of Earners in Moosup
The median family income in Moosup is $66,613, with families comprising 3+ earners (75) having the highest median family income of $124,271, while families with no earners (162) have the lowest median family income of $2,499, accounting for 7.5% and 16.3% of families, respectively.
| Number of Earners | # Families | Median Income |
| No Earners | 162 (16.3%) | $2,499 |
| 1 Earner | 405 (40.7%) | $49,757 |
| 2 Earners | 354 (35.5%) | $94,015 |
| 3+ Earners | 75 (7.5%) | $124,271 |
| Total | 996 (100.0%) | $66,613 |
Household Income in Moosup
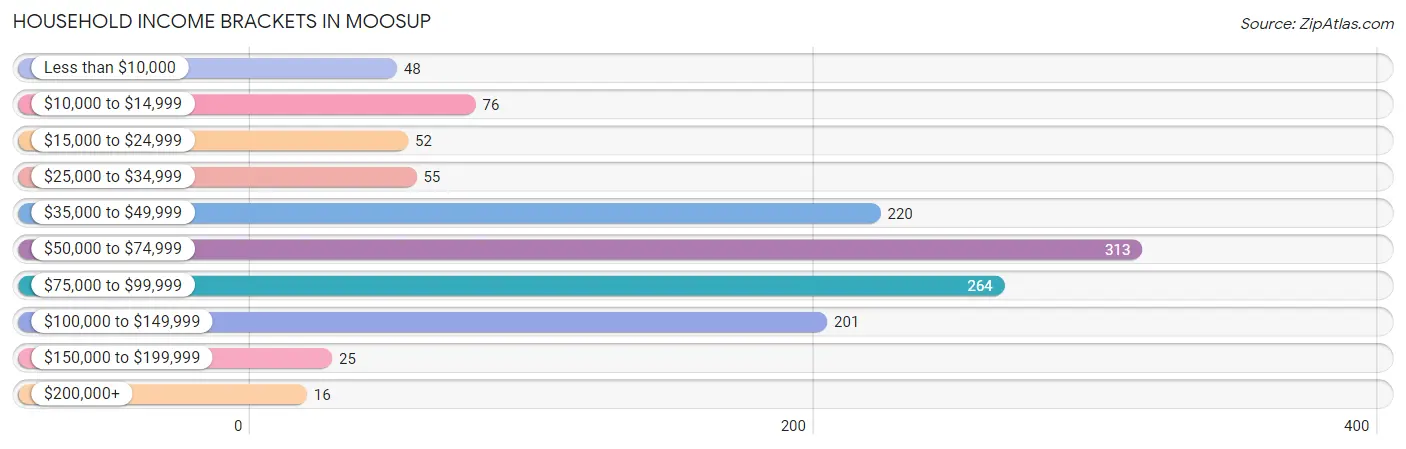
Household Income Brackets in Moosup
With 313 households falling in the category, the $50,000 to $74,999 income range is the most frequent in Moosup, accounting for 24.7% of all households. In contrast, only 16 households (1.3%) fall into the $200,000+ income bracket, making it the least populous group.
| Income Bracket | # Households | % Households |
| Less than $10,000 | 48 | 3.8% |
| $10,000 to $14,999 | 76 | 6.0% |
| $15,000 to $24,999 | 52 | 4.1% |
| $25,000 to $34,999 | 55 | 4.3% |
| $35,000 to $49,999 | 220 | 17.3% |
| $50,000 to $74,999 | 313 | 24.7% |
| $75,000 to $99,999 | 264 | 20.8% |
| $100,000 to $149,999 | 201 | 15.8% |
| $150,000 to $199,999 | 25 | 2.0% |
| $200,000+ | 16 | 1.3% |
Household Income by Householder Age in Moosup
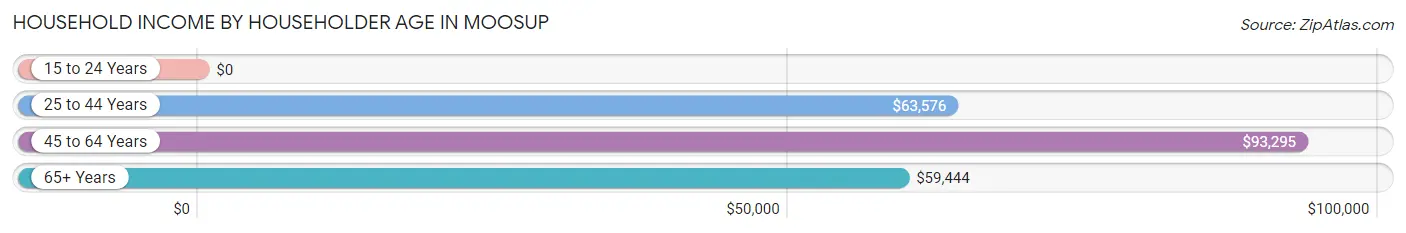
The median household income in Moosup is $64,466, with the highest median household income of $93,295 found in the 45 to 64 years age bracket for the primary householder. A total of 403 households (31.8%) fall into this category.
| Income Bracket | # Households | Median Income |
| 15 to 24 Years | 0 (0.0%) | $0 |
| 25 to 44 Years | 668 (52.6%) | $63,576 |
| 45 to 64 Years | 403 (31.8%) | $93,295 |
| 65+ Years | 198 (15.6%) | $59,444 |
| Total | 1,269 (100.0%) | $64,466 |
Poverty in Moosup
Income Below Poverty by Sex and Age in Moosup
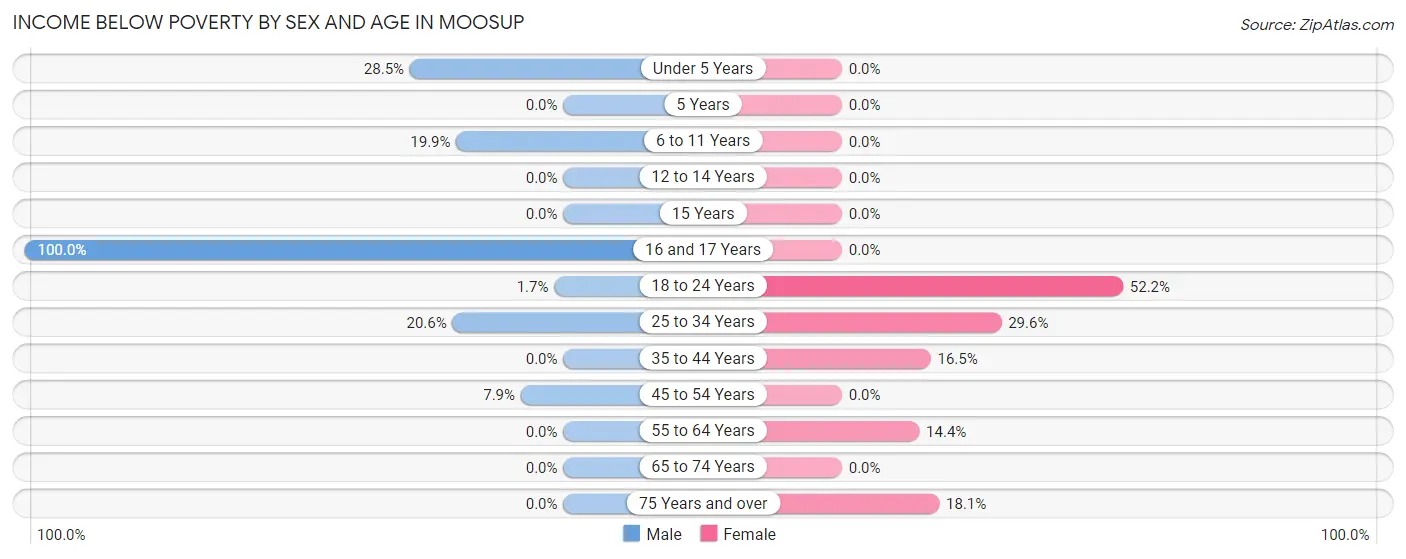
With 12.2% poverty level for males and 16.1% for females among the residents of Moosup, 16 and 17 year old males and 18 to 24 year old females are the most vulnerable to poverty, with 14 males (100.0%) and 48 females (52.2%) in their respective age groups living below the poverty level.
| Age Bracket | Male | Female |
| Under 5 Years | 45 (28.5%) | 0 (0.0%) |
| 5 Years | 0 (0.0%) | 0 (0.0%) |
| 6 to 11 Years | 29 (19.9%) | 0 (0.0%) |
| 12 to 14 Years | 0 (0.0%) | 0 (0.0%) |
| 15 Years | 0 (0.0%) | 0 (0.0%) |
| 16 and 17 Years | 14 (100.0%) | 0 (0.0%) |
| 18 to 24 Years | 2 (1.7%) | 48 (52.2%) |
| 25 to 34 Years | 88 (20.6%) | 124 (29.6%) |
| 35 to 44 Years | 0 (0.0%) | 30 (16.5%) |
| 45 to 54 Years | 15 (7.9%) | 0 (0.0%) |
| 55 to 64 Years | 0 (0.0%) | 29 (14.4%) |
| 65 to 74 Years | 0 (0.0%) | 0 (0.0%) |
| 75 Years and over | 0 (0.0%) | 26 (18.1%) |
| Total | 193 (12.2%) | 257 (16.1%) |
Income Above Poverty by Sex and Age in Moosup
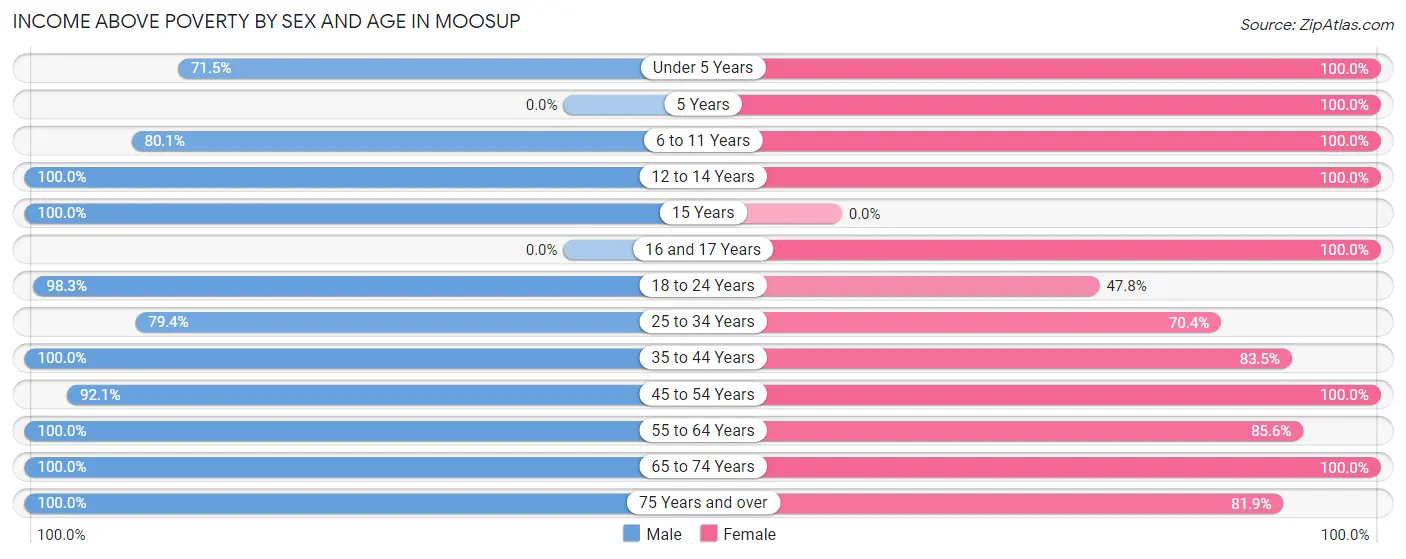
According to the poverty statistics in Moosup, males aged 12 to 14 years and females aged under 5 years are the age groups that are most secure financially, with 100.0% of males and 100.0% of females in these age groups living above the poverty line.
| Age Bracket | Male | Female |
| Under 5 Years | 113 (71.5%) | 94 (100.0%) |
| 5 Years | 0 (0.0%) | 47 (100.0%) |
| 6 to 11 Years | 117 (80.1%) | 30 (100.0%) |
| 12 to 14 Years | 16 (100.0%) | 32 (100.0%) |
| 15 Years | 12 (100.0%) | 0 (0.0%) |
| 16 and 17 Years | 0 (0.0%) | 145 (100.0%) |
| 18 to 24 Years | 117 (98.3%) | 44 (47.8%) |
| 25 to 34 Years | 340 (79.4%) | 295 (70.4%) |
| 35 to 44 Years | 172 (100.0%) | 152 (83.5%) |
| 45 to 54 Years | 175 (92.1%) | 106 (100.0%) |
| 55 to 64 Years | 212 (100.0%) | 173 (85.6%) |
| 65 to 74 Years | 50 (100.0%) | 100 (100.0%) |
| 75 Years and over | 65 (100.0%) | 118 (81.9%) |
| Total | 1,389 (87.8%) | 1,336 (83.9%) |
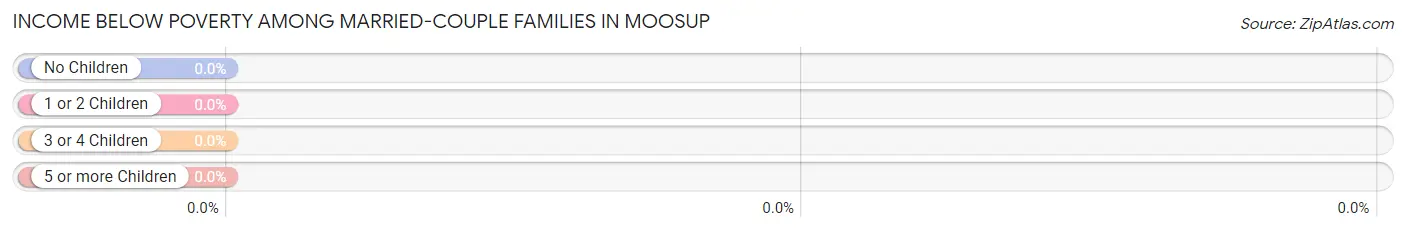
Income Below Poverty Among Married-Couple Families in Moosup
| Children | Above Poverty | Below Poverty |
| No Children | 395 (100.0%) | 0 (0.0%) |
| 1 or 2 Children | 227 (100.0%) | 0 (0.0%) |
| 3 or 4 Children | 31 (100.0%) | 0 (0.0%) |
| 5 or more Children | 0 (0.0%) | 0 (0.0%) |
| Total | 653 (100.0%) | 0 (0.0%) |
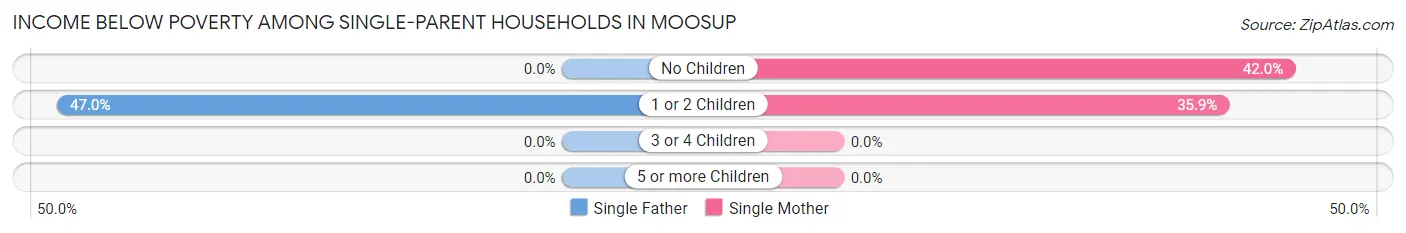
Income Below Poverty Among Single-Parent Households in Moosup
According to the poverty data in Moosup, 41.1% or 62 single-father households and 29.7% or 57 single-mother households are living below the poverty line. Among single-father households, those with 1 or 2 children have the highest poverty rate, with 62 households (47.0%) experiencing poverty. Likewise, among single-mother households, those with no children have the highest poverty rate, with 29 households (42.0%) falling below the poverty line.
| Children | Single Father | Single Mother |
| No Children | 0 (0.0%) | 29 (42.0%) |
| 1 or 2 Children | 62 (47.0%) | 28 (35.9%) |
| 3 or 4 Children | 0 (0.0%) | 0 (0.0%) |
| 5 or more Children | 0 (0.0%) | 0 (0.0%) |
| Total | 62 (41.1%) | 57 (29.7%) |
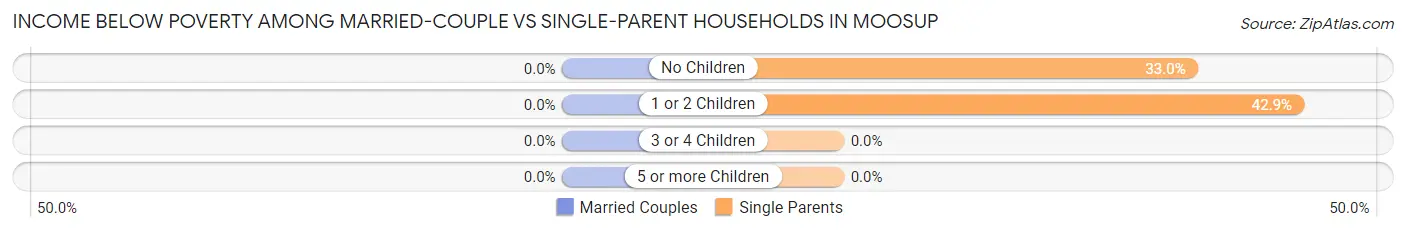
Income Below Poverty Among Married-Couple vs Single-Parent Households in Moosup
| Children | Married-Couple Families | Single-Parent Households |
| No Children | 0 (0.0%) | 29 (33.0%) |
| 1 or 2 Children | 0 (0.0%) | 90 (42.9%) |
| 3 or 4 Children | 0 (0.0%) | 0 (0.0%) |
| 5 or more Children | 0 (0.0%) | 0 (0.0%) |
| Total | 0 (0.0%) | 119 (34.7%) |
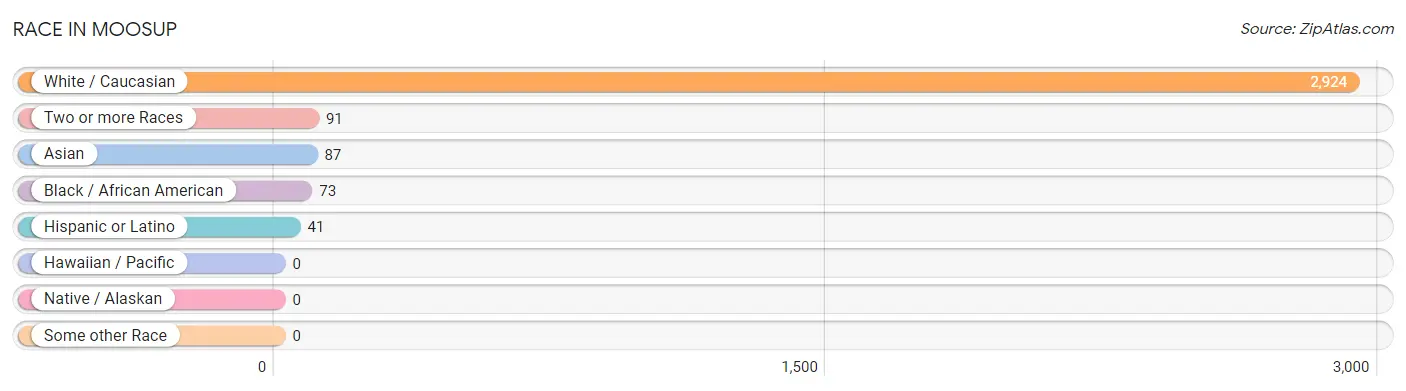
Race in Moosup
The most populous races in Moosup are White / Caucasian (2,924 | 92.1%), Two or more Races (91 | 2.9%), and Asian (87 | 2.7%).
| Race | # Population | % Population |
| Asian | 87 | 2.7% |
| Black / African American | 73 | 2.3% |
| Hawaiian / Pacific | 0 | 0.0% |
| Hispanic or Latino | 41 | 1.3% |
| Native / Alaskan | 0 | 0.0% |
| White / Caucasian | 2,924 | 92.1% |
| Two or more Races | 91 | 2.9% |
| Some other Race | 0 | 0.0% |
| Total | 3,175 | 100.0% |
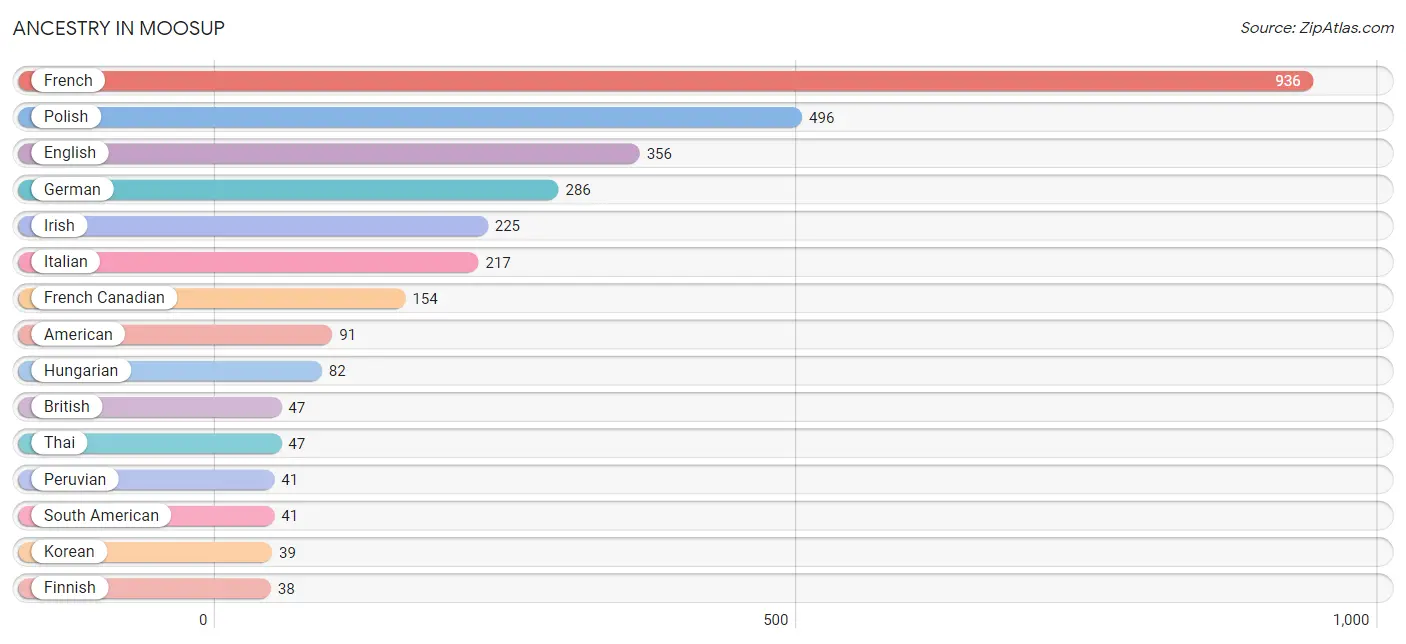
Ancestry in Moosup
The most populous ancestries reported in Moosup are French (936 | 29.5%), Polish (496 | 15.6%), English (356 | 11.2%), German (286 | 9.0%), and Irish (225 | 7.1%), together accounting for 72.4% of all Moosup residents.
| Ancestry | # Population | % Population |
| American | 91 | 2.9% |
| British | 47 | 1.5% |
| Burmese | 1 | 0.0% |
| Dutch | 35 | 1.1% |
| English | 356 | 11.2% |
| Finnish | 38 | 1.2% |
| French | 936 | 29.5% |
| French American Indian | 22 | 0.7% |
| French Canadian | 154 | 4.9% |
| German | 286 | 9.0% |
| Hungarian | 82 | 2.6% |
| Irish | 225 | 7.1% |
| Italian | 217 | 6.8% |
| Korean | 39 | 1.2% |
| Peruvian | 41 | 1.3% |
| Polish | 496 | 15.6% |
| Portuguese | 2 | 0.1% |
| Russian | 8 | 0.3% |
| Scotch-Irish | 27 | 0.9% |
| Scottish | 35 | 1.1% |
| Slavic | 11 | 0.4% |
| South American | 41 | 1.3% |
| Swiss | 2 | 0.1% |
| Thai | 47 | 1.5% | View All 24 Rows |
Immigrants in Moosup
The most numerous immigrant groups reported in Moosup came from Asia (75 | 2.4%), Latin America (54 | 1.7%), South America (54 | 1.7%), India (47 | 1.5%), and South Central Asia (47 | 1.5%), together accounting for 8.7% of all Moosup residents.
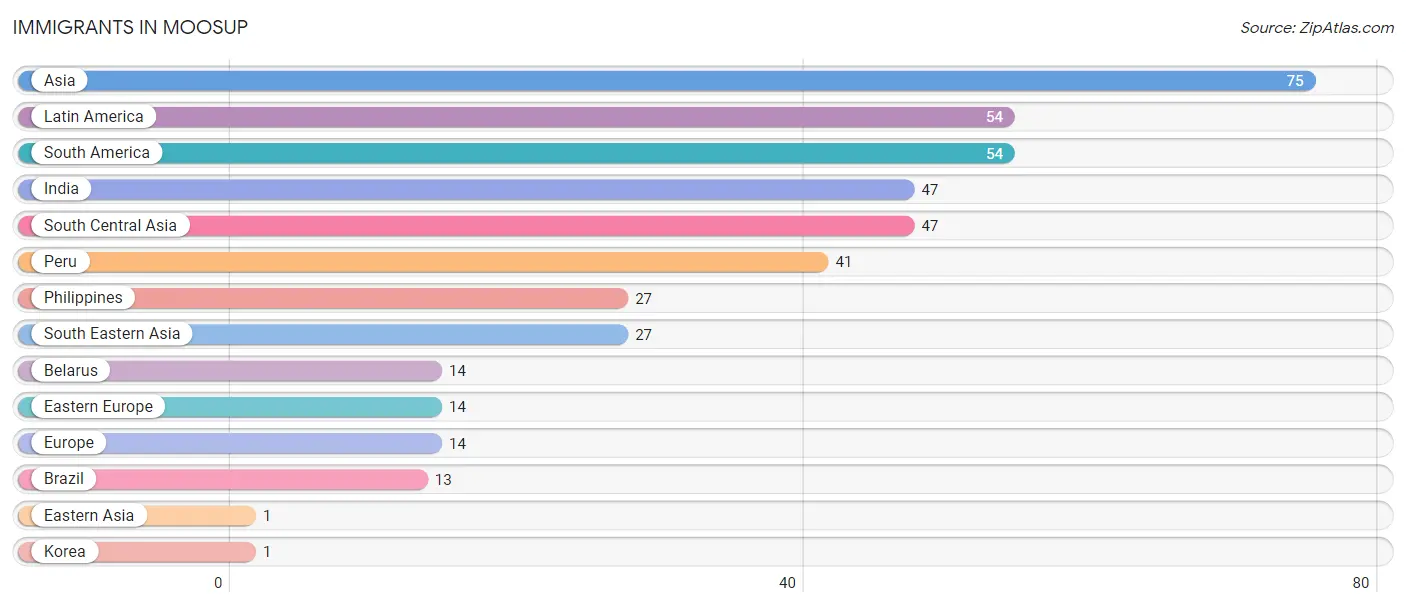
| Immigration Origin | # Population | % Population |
| Asia | 75 | 2.4% |
| Belarus | 14 | 0.4% |
| Brazil | 13 | 0.4% |
| Eastern Asia | 1 | 0.0% |
| Eastern Europe | 14 | 0.4% |
| Europe | 14 | 0.4% |
| India | 47 | 1.5% |
| Korea | 1 | 0.0% |
| Latin America | 54 | 1.7% |
| Peru | 41 | 1.3% |
| Philippines | 27 | 0.9% |
| South America | 54 | 1.7% |
| South Central Asia | 47 | 1.5% |
| South Eastern Asia | 27 | 0.9% | View All 14 Rows |
Sex and Age in Moosup
Sex and Age in Moosup
The most populous age groups in Moosup are 25 to 29 Years (289 | 18.3%) for men and 25 to 29 Years (299 | 18.8%) for women.
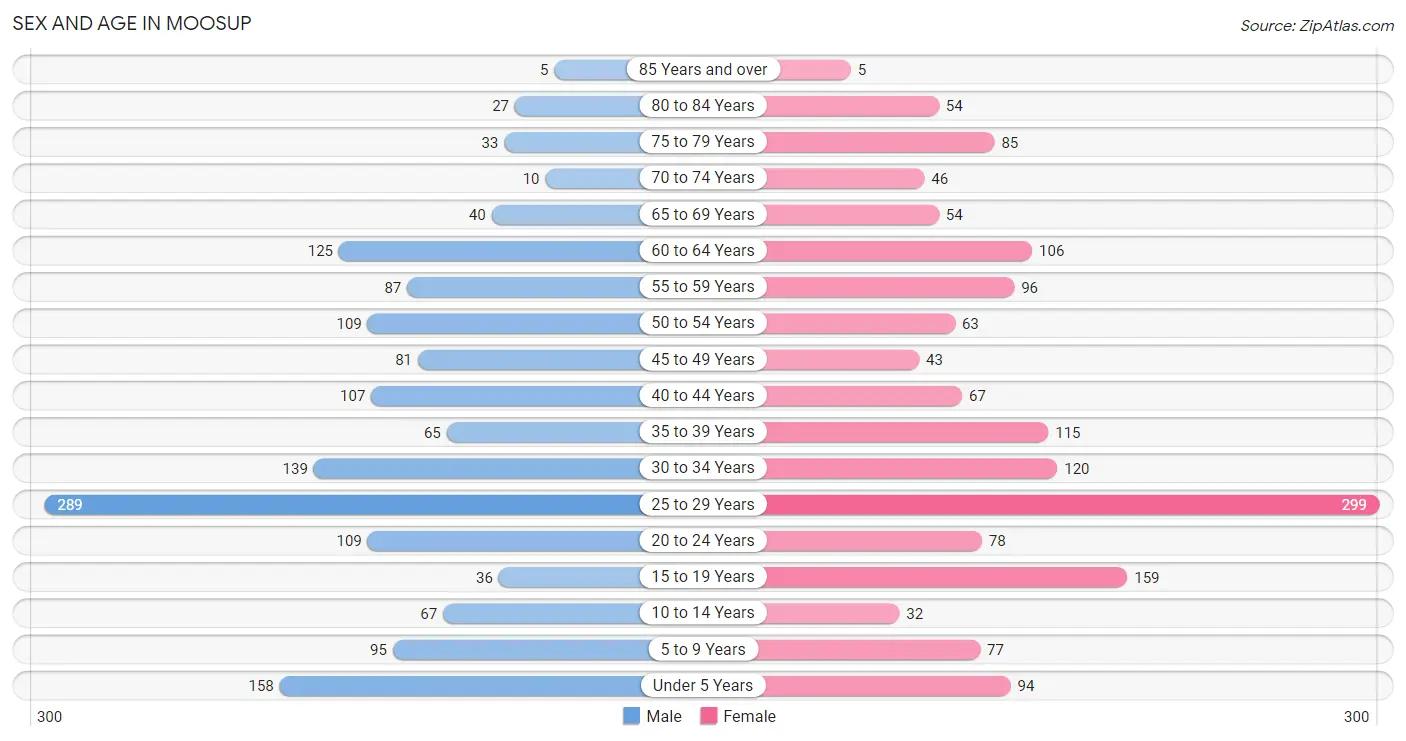
| Age Bracket | Male | Female |
| Under 5 Years | 158 (10.0%) | 94 (5.9%) |
| 5 to 9 Years | 95 (6.0%) | 77 (4.8%) |
| 10 to 14 Years | 67 (4.2%) | 32 (2.0%) |
| 15 to 19 Years | 36 (2.3%) | 159 (10.0%) |
| 20 to 24 Years | 109 (6.9%) | 78 (4.9%) |
| 25 to 29 Years | 289 (18.3%) | 299 (18.8%) |
| 30 to 34 Years | 139 (8.8%) | 120 (7.5%) |
| 35 to 39 Years | 65 (4.1%) | 115 (7.2%) |
| 40 to 44 Years | 107 (6.8%) | 67 (4.2%) |
| 45 to 49 Years | 81 (5.1%) | 43 (2.7%) |
| 50 to 54 Years | 109 (6.9%) | 63 (4.0%) |
| 55 to 59 Years | 87 (5.5%) | 96 (6.0%) |
| 60 to 64 Years | 125 (7.9%) | 106 (6.7%) |
| 65 to 69 Years | 40 (2.5%) | 54 (3.4%) |
| 70 to 74 Years | 10 (0.6%) | 46 (2.9%) |
| 75 to 79 Years | 33 (2.1%) | 85 (5.3%) |
| 80 to 84 Years | 27 (1.7%) | 54 (3.4%) |
| 85 Years and over | 5 (0.3%) | 5 (0.3%) |
| Total | 1,582 (100.0%) | 1,593 (100.0%) |
Families and Households in Moosup
Median Family Size in Moosup
The median family size in Moosup is 2.67 persons per family, with married-couple families (653 | 65.6%) accounting for the largest median family size of 2.78 persons per family. On the other hand, single male/father families (151 | 15.2%) represent the smallest median family size with 2.15 persons per family.
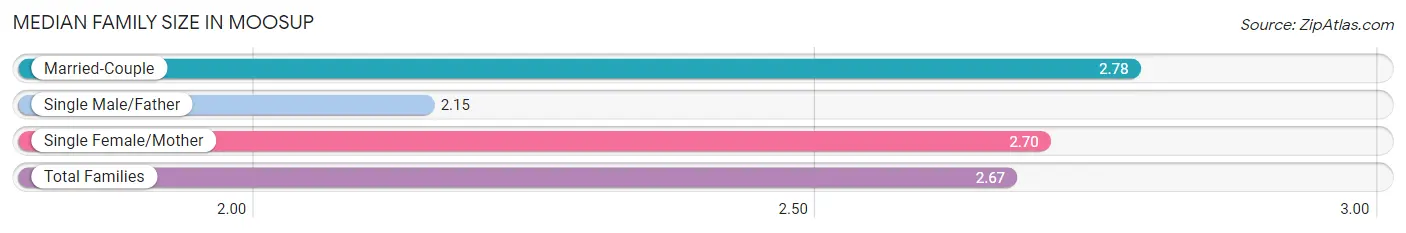
| Family Type | # Families | Family Size |
| Married-Couple | 653 (65.6%) | 2.78 |
| Single Male/Father | 151 (15.2%) | 2.15 |
| Single Female/Mother | 192 (19.3%) | 2.70 |
| Total Families | 996 (100.0%) | 2.67 |
Median Household Size in Moosup
The median household size in Moosup is 2.49 persons per household, with single female/mother households (192 | 15.1%) accounting for the largest median household size of 2.97 persons per household. non-family households (273 | 21.5%) represent the smallest median household size with 1.48 persons per household.
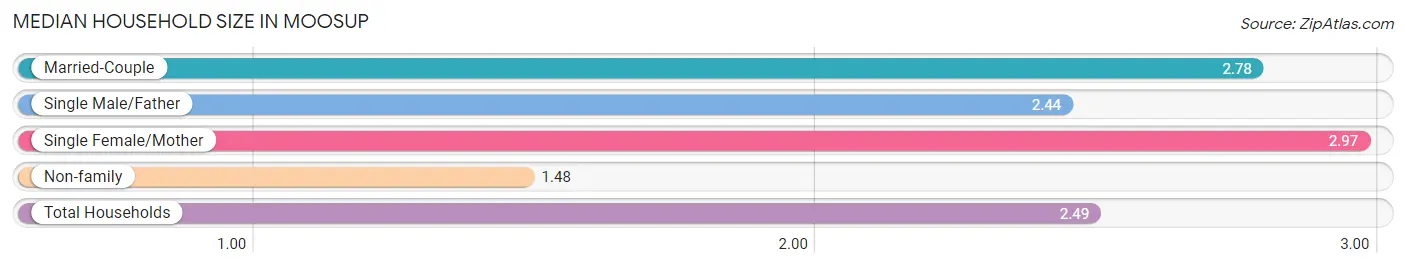
| Household Type | # Households | Household Size |
| Married-Couple | 653 (51.5%) | 2.78 |
| Single Male/Father | 151 (11.9%) | 2.44 |
| Single Female/Mother | 192 (15.1%) | 2.97 |
| Non-family | 273 (21.5%) | 1.48 |
| Total Households | 1,269 (100.0%) | 2.49 |
Household Size by Marriage Status in Moosup
Out of a total of 1,269 households in Moosup, 996 (78.5%) are family households, while 273 (21.5%) are nonfamily households. The most numerous type of family households are 3-person households, comprising 426, and the most common type of nonfamily households are 1-person households, comprising 163.
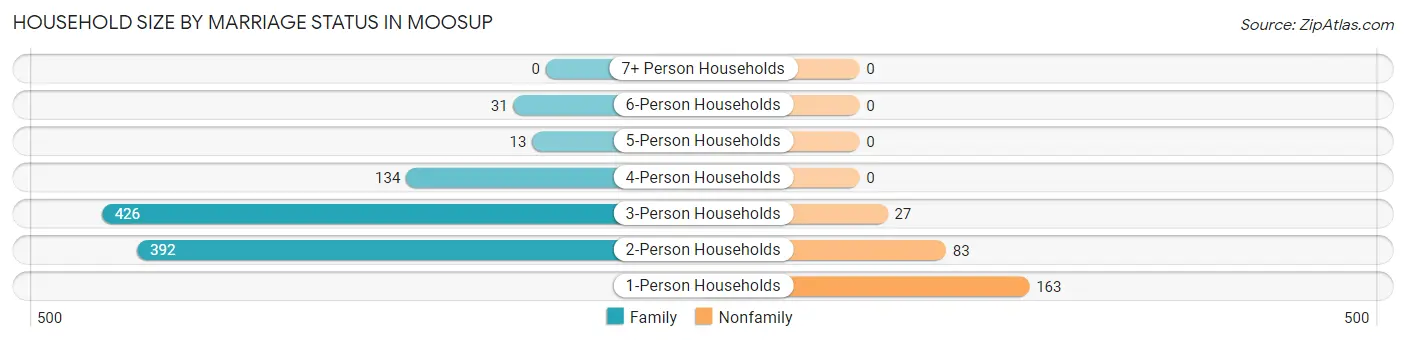
| Household Size | Family Households | Nonfamily Households |
| 1-Person Households | - | 163 (12.8%) |
| 2-Person Households | 392 (30.9%) | 83 (6.5%) |
| 3-Person Households | 426 (33.6%) | 27 (2.1%) |
| 4-Person Households | 134 (10.6%) | 0 (0.0%) |
| 5-Person Households | 13 (1.0%) | 0 (0.0%) |
| 6-Person Households | 31 (2.4%) | 0 (0.0%) |
| 7+ Person Households | 0 (0.0%) | 0 (0.0%) |
| Total | 996 (78.5%) | 273 (21.5%) |
Female Fertility in Moosup
Fertility by Age in Moosup
Average fertility rate in Moosup is 84.0 births per 1,000 women. Women in the age bracket of 20 to 34 years have the highest fertility rate with 155.0 births per 1,000 women. Women in the age bracket of 20 to 34 years acount for 100.0% of all women with births.
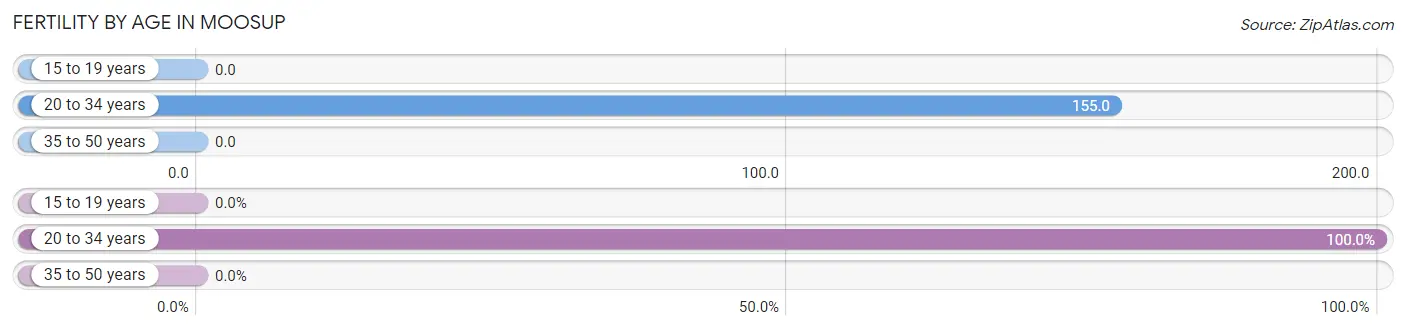
| Age Bracket | Women with Births | Births / 1,000 Women |
| 15 to 19 years | 0 (0.0%) | 0.0 |
| 20 to 34 years | 77 (100.0%) | 155.0 |
| 35 to 50 years | 0 (0.0%) | 0.0 |
| Total | 77 (100.0%) | 84.0 |
Fertility by Age by Marriage Status in Moosup
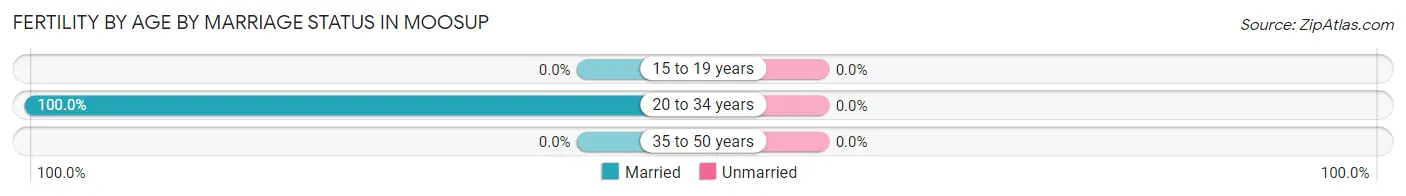
| Age Bracket | Married | Unmarried |
| 15 to 19 years | 0 (0.0%) | 0 (0.0%) |
| 20 to 34 years | 77 (100.0%) | 0 (0.0%) |
| 35 to 50 years | 0 (0.0%) | 0 (0.0%) |
| Total | 77 (100.0%) | 0 (0.0%) |
Fertility by Education in Moosup
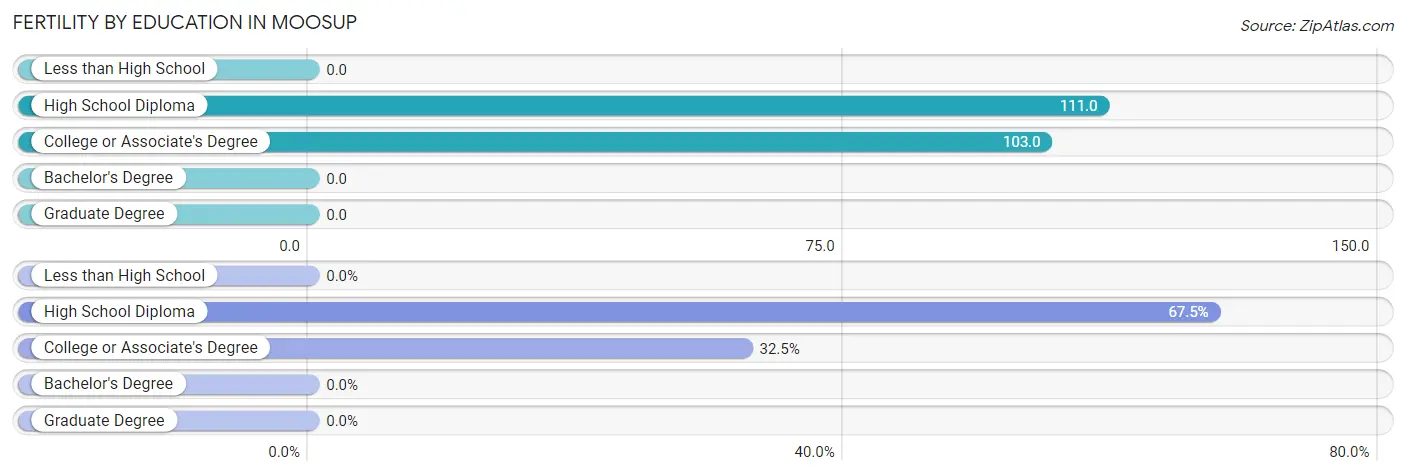
| Educational Attainment | Women with Births | Births / 1,000 Women |
| Less than High School | 0 (0.0%) | 0.0 |
| High School Diploma | 52 (67.5%) | 111.0 |
| College or Associate's Degree | 25 (32.5%) | 103.0 |
| Bachelor's Degree | 0 (0.0%) | 0.0 |
| Graduate Degree | 0 (0.0%) | 0.0 |
| Total | 77 (100.0%) | 84.0 |
Fertility by Education by Marriage Status in Moosup
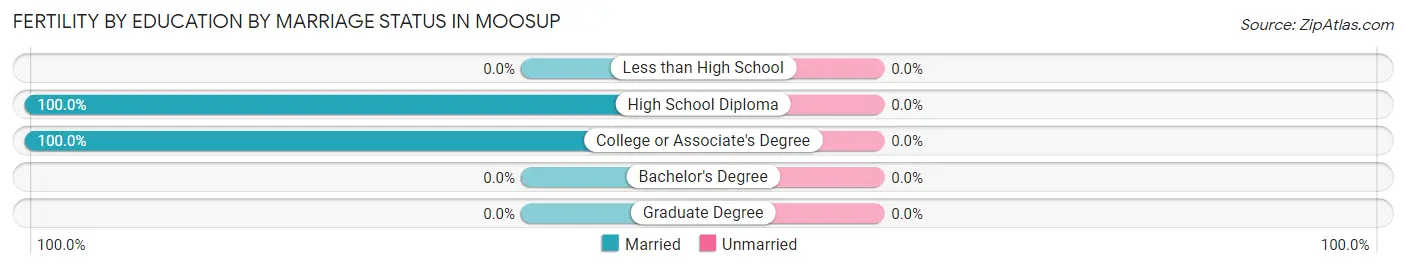
| Educational Attainment | Married | Unmarried |
| Less than High School | 0 (0.0%) | 0 (0.0%) |
| High School Diploma | 52 (100.0%) | 0 (0.0%) |
| College or Associate's Degree | 25 (100.0%) | 0 (0.0%) |
| Bachelor's Degree | 0 (0.0%) | 0 (0.0%) |
| Graduate Degree | 0 (0.0%) | 0 (0.0%) |
| Total | 77 (100.0%) | 0 (0.0%) |
Employment Characteristics in Moosup
Employment by Class of Employer in Moosup
Among the 1,625 employed individuals in Moosup, private company employees (1,176 | 72.4%), not-for-profit organizations (146 | 9.0%), and self-employed (not incorporated) (110 | 6.8%) make up the most common classes of employment.
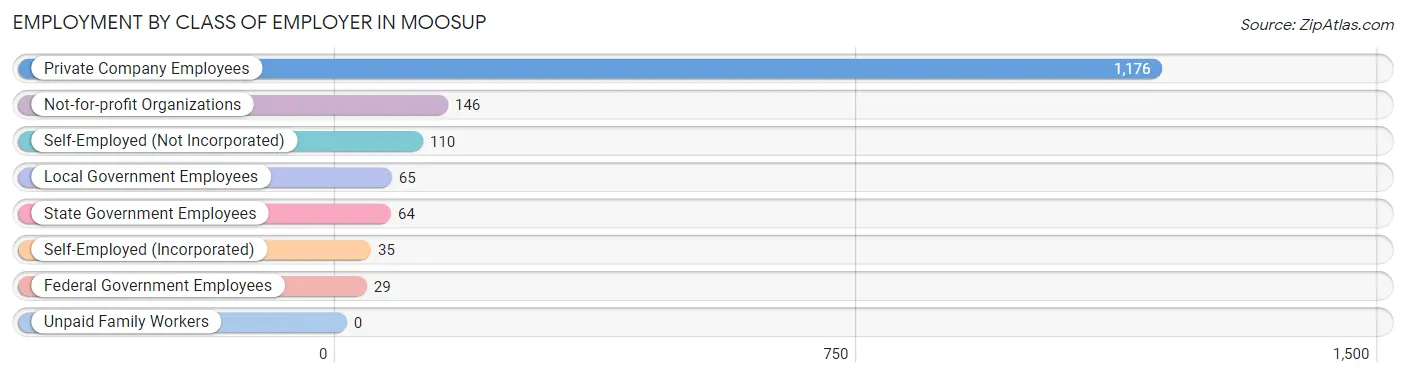
| Employer Class | # Employees | % Employees |
| Private Company Employees | 1,176 | 72.4% |
| Self-Employed (Incorporated) | 35 | 2.1% |
| Self-Employed (Not Incorporated) | 110 | 6.8% |
| Not-for-profit Organizations | 146 | 9.0% |
| Local Government Employees | 65 | 4.0% |
| State Government Employees | 64 | 3.9% |
| Federal Government Employees | 29 | 1.8% |
| Unpaid Family Workers | 0 | 0.0% |
| Total | 1,625 | 100.0% |
Employment Status by Age in Moosup
According to the labor force statistics for Moosup, out of the total population over 16 years of age (2,640), 69.4% or 1,832 individuals are in the labor force, with 6.8% or 125 of them unemployed. The age group with the highest labor force participation rate is 35 to 44 years, with 92.1% or 326 individuals in the labor force. Within the labor force, the 16 to 19 years age range has the highest percentage of unemployed individuals, with 64.3% or 18 of them being unemployed.
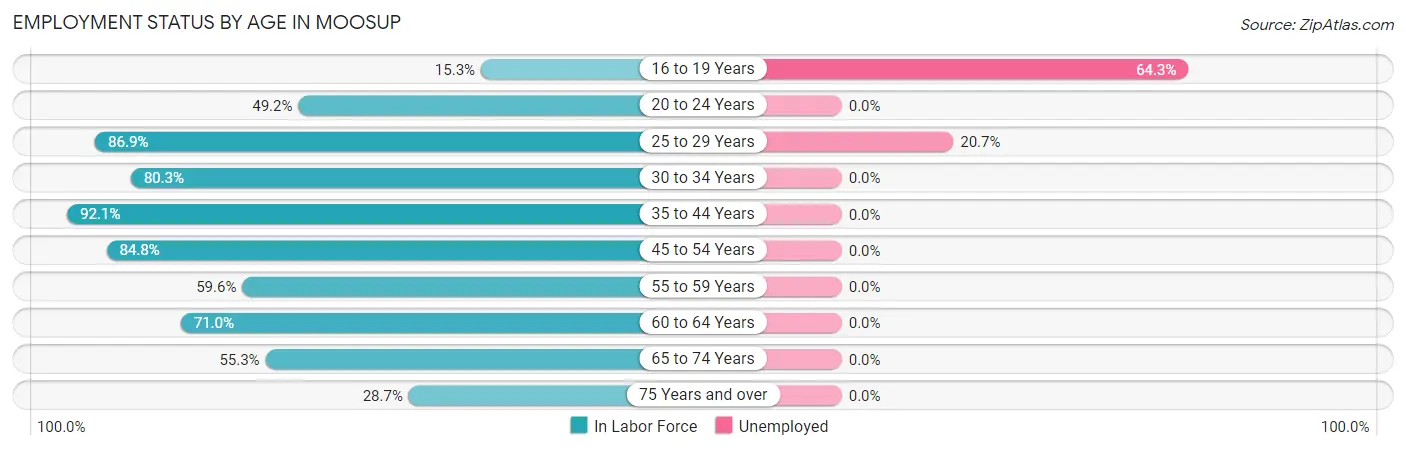
| Age Bracket | In Labor Force | Unemployed |
| 16 to 19 Years | 28 (15.3%) | 18 (64.3%) |
| 20 to 24 Years | 92 (49.2%) | 0 (0.0%) |
| 25 to 29 Years | 511 (86.9%) | 106 (20.7%) |
| 30 to 34 Years | 208 (80.3%) | 0 (0.0%) |
| 35 to 44 Years | 326 (92.1%) | 0 (0.0%) |
| 45 to 54 Years | 251 (84.8%) | 0 (0.0%) |
| 55 to 59 Years | 109 (59.6%) | 0 (0.0%) |
| 60 to 64 Years | 164 (71.0%) | 0 (0.0%) |
| 65 to 74 Years | 83 (55.3%) | 0 (0.0%) |
| 75 Years and over | 60 (28.7%) | 0 (0.0%) |
| Total | 1,832 (69.4%) | 125 (6.8%) |
Employment Status by Educational Attainment in Moosup
According to labor force statistics for Moosup, 82.1% of individuals (1,569) out of the total population between 25 and 64 years of age (1,911) are in the labor force, with 6.8% or 107 of them being unemployed. The group with the highest labor force participation rate are those with the educational attainment of high school diploma, with 87.2% or 947 individuals in the labor force. Within the labor force, individuals with high school diploma education have the highest percentage of unemployment, with 11.2% or 106 of them being unemployed.
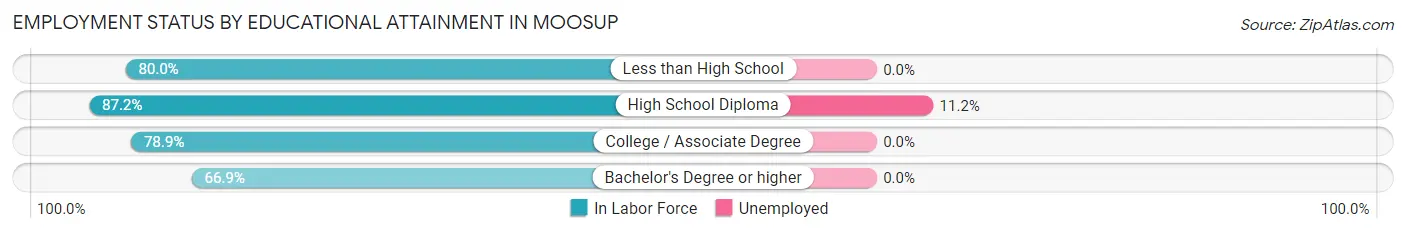
| Educational Attainment | In Labor Force | Unemployed |
| Less than High School | 8 (80.0%) | 0 (0.0%) |
| High School Diploma | 947 (87.2%) | 122 (11.2%) |
| College / Associate Degree | 452 (78.9%) | 0 (0.0%) |
| Bachelor's Degree or higher | 162 (66.9%) | 0 (0.0%) |
| Total | 1,569 (82.1%) | 130 (6.8%) |
Employment Occupations by Sex in Moosup
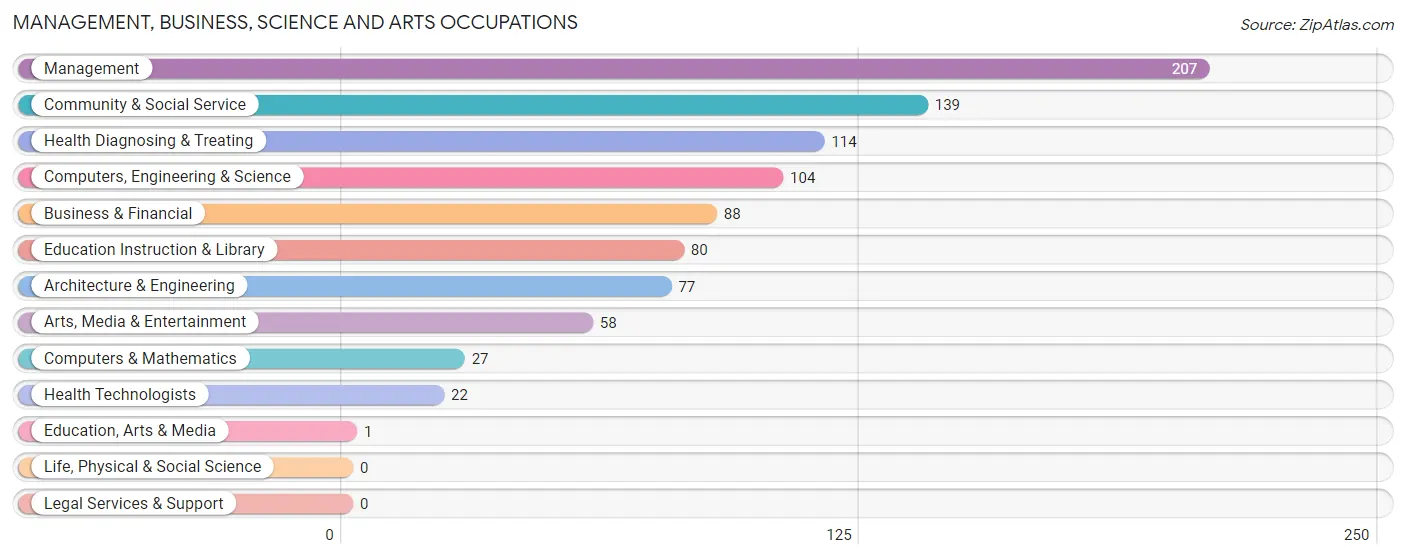
Management, Business, Science and Arts Occupations
The most common Management, Business, Science and Arts occupations in Moosup are Management (207 | 12.1%), Community & Social Service (139 | 8.1%), Health Diagnosing & Treating (114 | 6.7%), Computers, Engineering & Science (104 | 6.1%), and Business & Financial (88 | 5.1%).
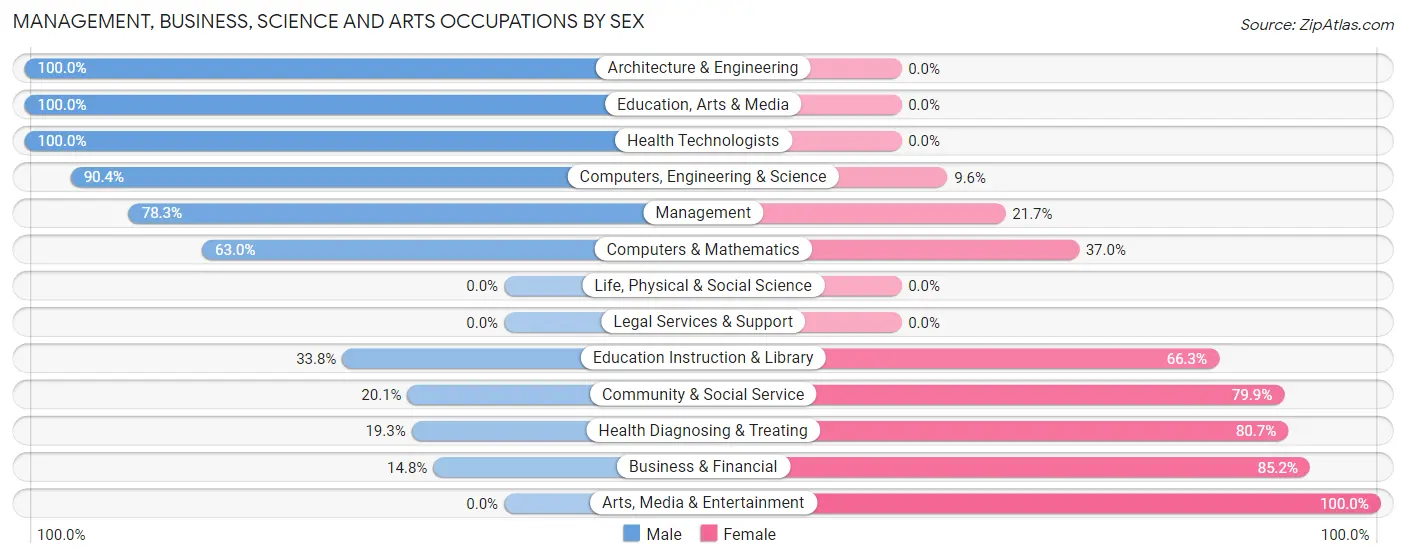
Management, Business, Science and Arts Occupations by Sex
Within the Management, Business, Science and Arts occupations in Moosup, the most male-oriented occupations are Architecture & Engineering (100.0%), Education, Arts & Media (100.0%), and Health Technologists (100.0%), while the most female-oriented occupations are Arts, Media & Entertainment (100.0%), Business & Financial (85.2%), and Health Diagnosing & Treating (80.7%).
| Occupation | Male | Female |
| Management | 162 (78.3%) | 45 (21.7%) |
| Business & Financial | 13 (14.8%) | 75 (85.2%) |
| Computers, Engineering & Science | 94 (90.4%) | 10 (9.6%) |
| Computers & Mathematics | 17 (63.0%) | 10 (37.0%) |
| Architecture & Engineering | 77 (100.0%) | 0 (0.0%) |
| Life, Physical & Social Science | 0 (0.0%) | 0 (0.0%) |
| Community & Social Service | 28 (20.1%) | 111 (79.9%) |
| Education, Arts & Media | 1 (100.0%) | 0 (0.0%) |
| Legal Services & Support | 0 (0.0%) | 0 (0.0%) |
| Education Instruction & Library | 27 (33.8%) | 53 (66.2%) |
| Arts, Media & Entertainment | 0 (0.0%) | 58 (100.0%) |
| Health Diagnosing & Treating | 22 (19.3%) | 92 (80.7%) |
| Health Technologists | 22 (100.0%) | 0 (0.0%) |
| Total (Category) | 319 (48.9%) | 333 (51.1%) |
| Total (Overall) | 962 (56.3%) | 746 (43.7%) |
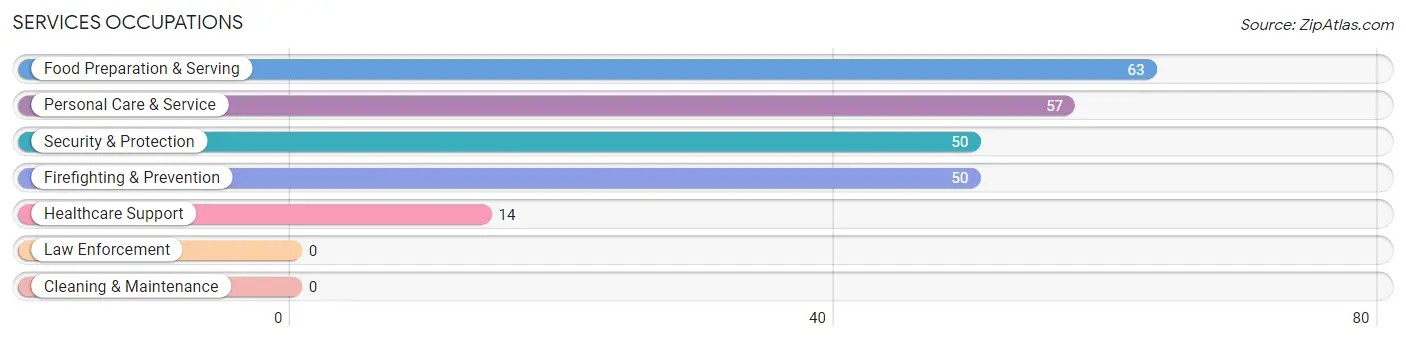
Services Occupations
The most common Services occupations in Moosup are Food Preparation & Serving (63 | 3.7%), Personal Care & Service (57 | 3.3%), Security & Protection (50 | 2.9%), Firefighting & Prevention (50 | 2.9%), and Healthcare Support (14 | 0.8%).
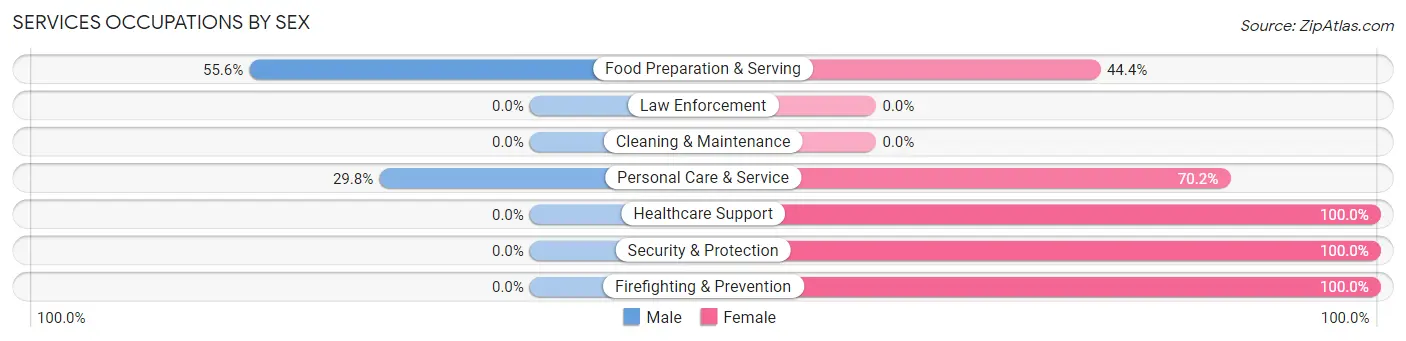
Services Occupations by Sex
Within the Services occupations in Moosup, the most male-oriented occupations are Food Preparation & Serving (55.6%), and Personal Care & Service (29.8%), while the most female-oriented occupations are Healthcare Support (100.0%), Security & Protection (100.0%), and Firefighting & Prevention (100.0%).
| Occupation | Male | Female |
| Healthcare Support | 0 (0.0%) | 14 (100.0%) |
| Security & Protection | 0 (0.0%) | 50 (100.0%) |
| Firefighting & Prevention | 0 (0.0%) | 50 (100.0%) |
| Law Enforcement | 0 (0.0%) | 0 (0.0%) |
| Food Preparation & Serving | 35 (55.6%) | 28 (44.4%) |
| Cleaning & Maintenance | 0 (0.0%) | 0 (0.0%) |
| Personal Care & Service | 17 (29.8%) | 40 (70.2%) |
| Total (Category) | 52 (28.3%) | 132 (71.7%) |
| Total (Overall) | 962 (56.3%) | 746 (43.7%) |
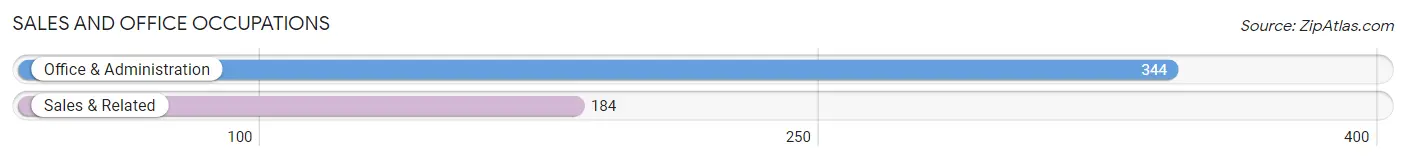
Sales and Office Occupations
The most common Sales and Office occupations in Moosup are Office & Administration (344 | 20.1%), and Sales & Related (184 | 10.8%).
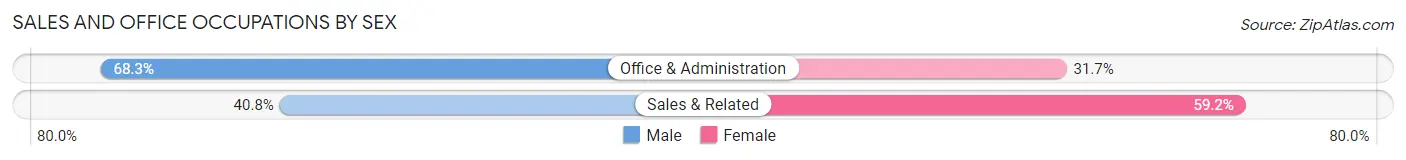
Sales and Office Occupations by Sex
| Occupation | Male | Female |
| Sales & Related | 75 (40.8%) | 109 (59.2%) |
| Office & Administration | 235 (68.3%) | 109 (31.7%) |
| Total (Category) | 310 (58.7%) | 218 (41.3%) |
| Total (Overall) | 962 (56.3%) | 746 (43.7%) |
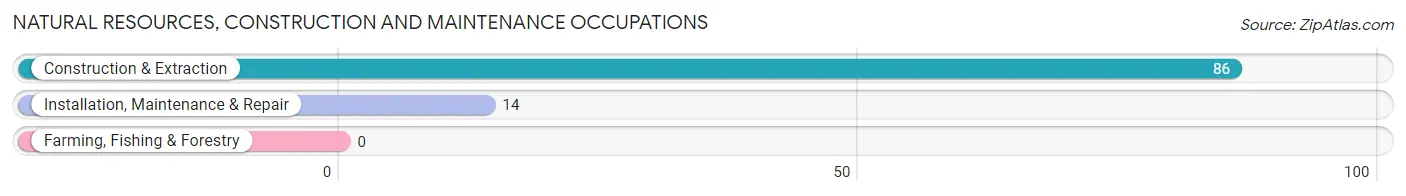
Natural Resources, Construction and Maintenance Occupations
The most common Natural Resources, Construction and Maintenance occupations in Moosup are Construction & Extraction (86 | 5.0%), and Installation, Maintenance & Repair (14 | 0.8%).
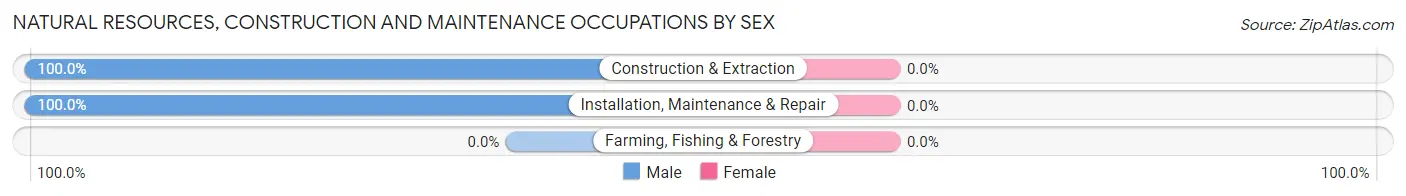
Natural Resources, Construction and Maintenance Occupations by Sex
| Occupation | Male | Female |
| Farming, Fishing & Forestry | 0 (0.0%) | 0 (0.0%) |
| Construction & Extraction | 86 (100.0%) | 0 (0.0%) |
| Installation, Maintenance & Repair | 14 (100.0%) | 0 (0.0%) |
| Total (Category) | 100 (100.0%) | 0 (0.0%) |
| Total (Overall) | 962 (56.3%) | 746 (43.7%) |
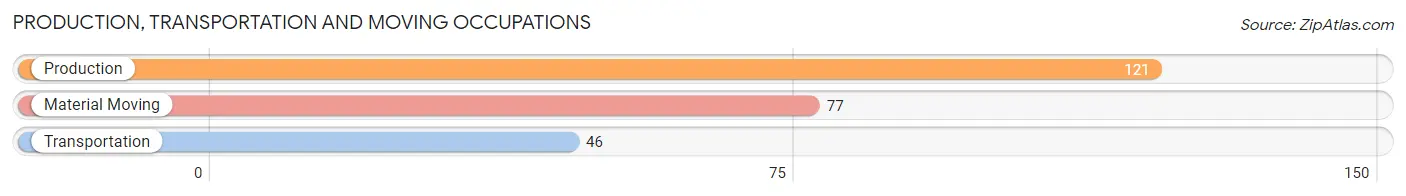
Production, Transportation and Moving Occupations
The most common Production, Transportation and Moving occupations in Moosup are Production (121 | 7.1%), Material Moving (77 | 4.5%), and Transportation (46 | 2.7%).
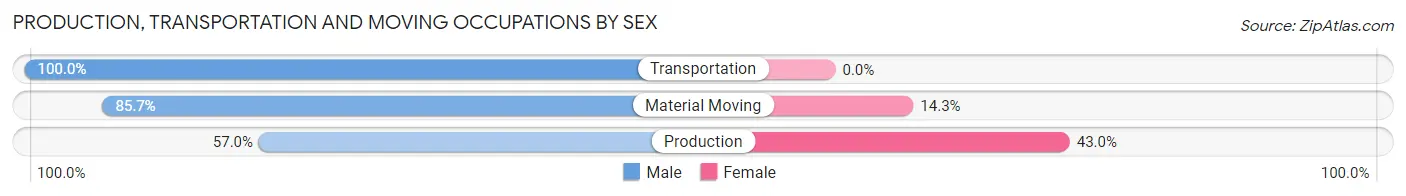
Production, Transportation and Moving Occupations by Sex
| Occupation | Male | Female |
| Production | 69 (57.0%) | 52 (43.0%) |
| Transportation | 46 (100.0%) | 0 (0.0%) |
| Material Moving | 66 (85.7%) | 11 (14.3%) |
| Total (Category) | 181 (74.2%) | 63 (25.8%) |
| Total (Overall) | 962 (56.3%) | 746 (43.7%) |
Employment Industries by Sex in Moosup
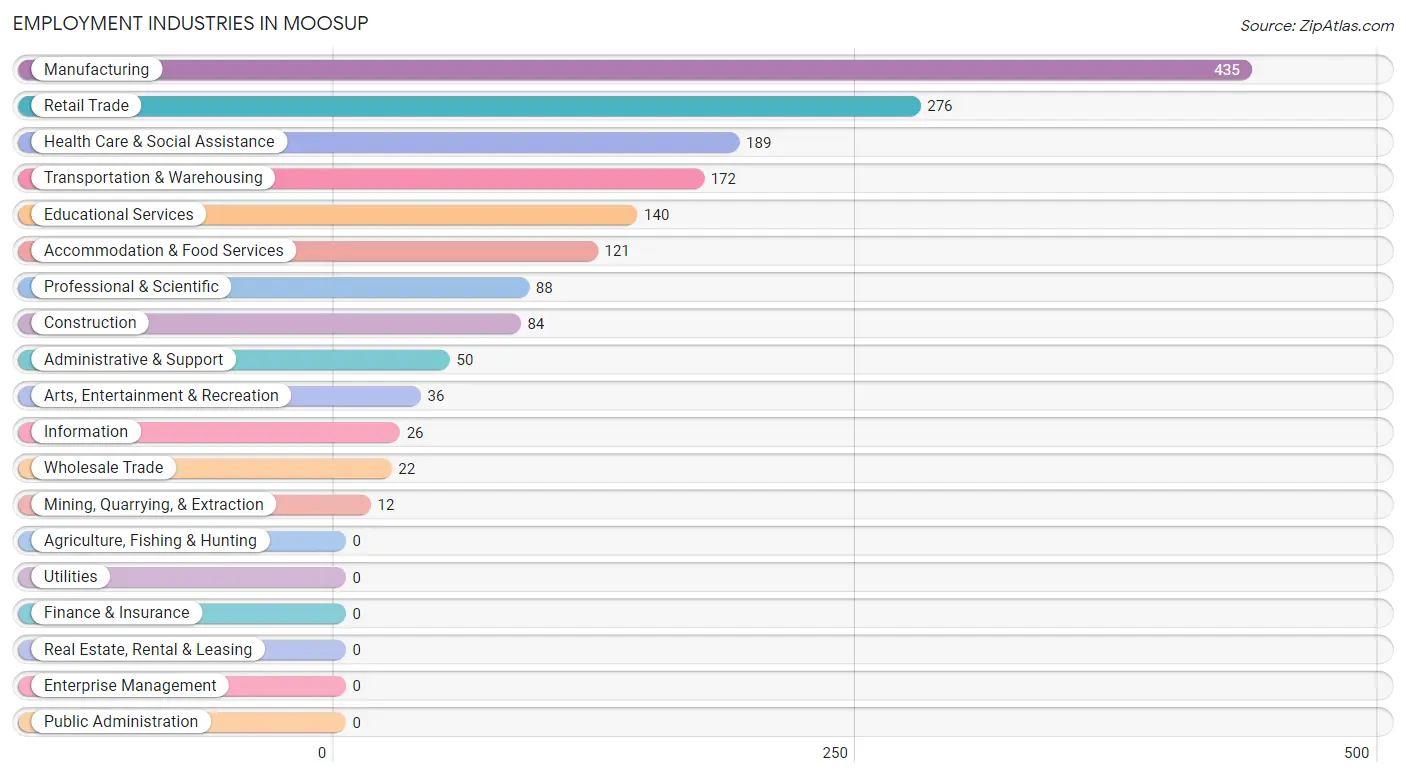
Employment Industries in Moosup
The major employment industries in Moosup include Manufacturing (435 | 25.5%), Retail Trade (276 | 16.2%), Health Care & Social Assistance (189 | 11.1%), Transportation & Warehousing (172 | 10.1%), and Educational Services (140 | 8.2%).
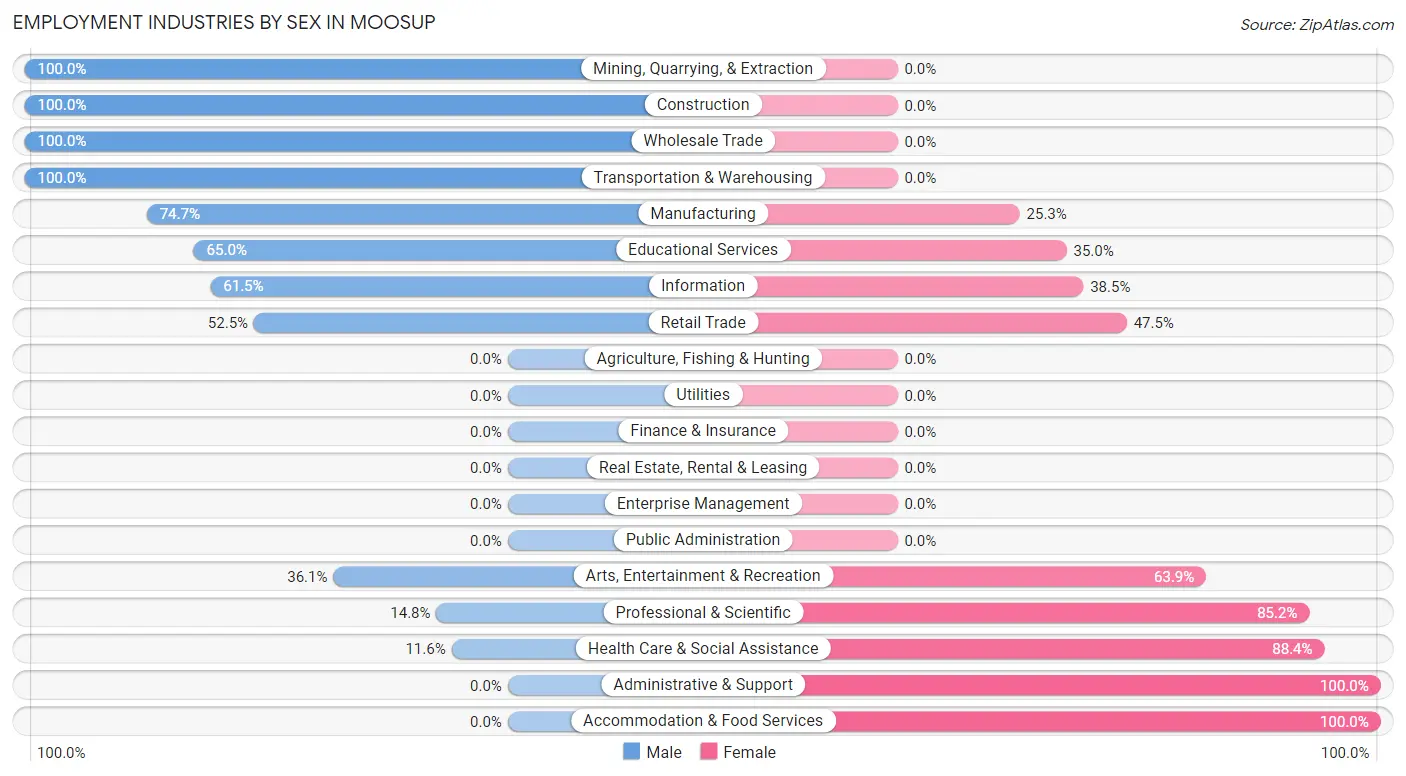
Employment Industries by Sex in Moosup
The Moosup industries that see more men than women are Mining, Quarrying, & Extraction (100.0%), Construction (100.0%), and Wholesale Trade (100.0%), whereas the industries that tend to have a higher number of women are Administrative & Support (100.0%), Accommodation & Food Services (100.0%), and Health Care & Social Assistance (88.4%).
| Industry | Male | Female |
| Agriculture, Fishing & Hunting | 0 (0.0%) | 0 (0.0%) |
| Mining, Quarrying, & Extraction | 12 (100.0%) | 0 (0.0%) |
| Construction | 84 (100.0%) | 0 (0.0%) |
| Manufacturing | 325 (74.7%) | 110 (25.3%) |
| Wholesale Trade | 22 (100.0%) | 0 (0.0%) |
| Retail Trade | 145 (52.5%) | 131 (47.5%) |
| Transportation & Warehousing | 172 (100.0%) | 0 (0.0%) |
| Utilities | 0 (0.0%) | 0 (0.0%) |
| Information | 16 (61.5%) | 10 (38.5%) |
| Finance & Insurance | 0 (0.0%) | 0 (0.0%) |
| Real Estate, Rental & Leasing | 0 (0.0%) | 0 (0.0%) |
| Professional & Scientific | 13 (14.8%) | 75 (85.2%) |
| Enterprise Management | 0 (0.0%) | 0 (0.0%) |
| Administrative & Support | 0 (0.0%) | 50 (100.0%) |
| Educational Services | 91 (65.0%) | 49 (35.0%) |
| Health Care & Social Assistance | 22 (11.6%) | 167 (88.4%) |
| Arts, Entertainment & Recreation | 13 (36.1%) | 23 (63.9%) |
| Accommodation & Food Services | 0 (0.0%) | 121 (100.0%) |
| Public Administration | 0 (0.0%) | 0 (0.0%) |
| Total | 962 (56.3%) | 746 (43.7%) |
Education in Moosup
School Enrollment in Moosup
The most common levels of schooling among the 427 students in Moosup are high school (219 | 51.3%), elementary school (74 | 17.3%), and college / undergraduate (63 | 14.7%).
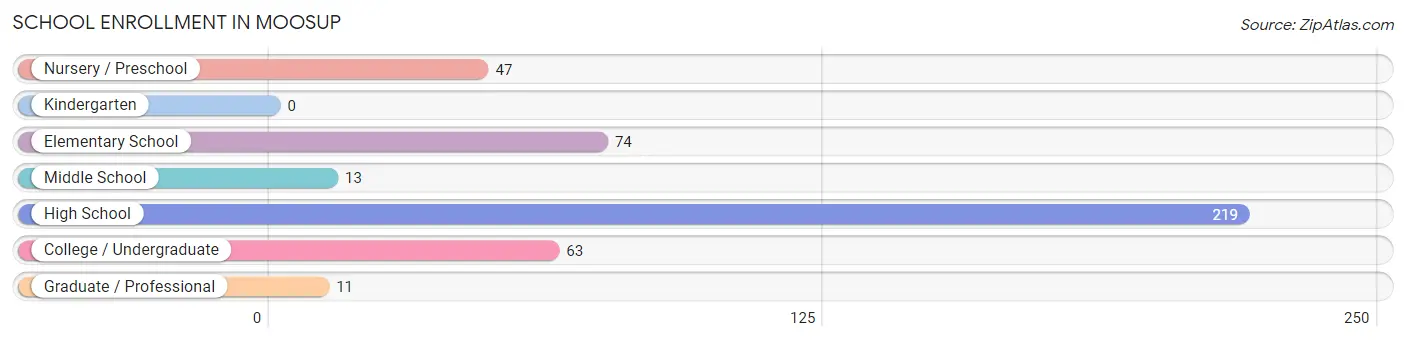
| School Level | # Students | % Students |
| Nursery / Preschool | 47 | 11.0% |
| Kindergarten | 0 | 0.0% |
| Elementary School | 74 | 17.3% |
| Middle School | 13 | 3.0% |
| High School | 219 | 51.3% |
| College / Undergraduate | 63 | 14.7% |
| Graduate / Professional | 11 | 2.6% |
| Total | 427 | 100.0% |
School Enrollment by Age by Funding Source in Moosup
Out of a total of 427 students who are enrolled in schools in Moosup, 32 (7.5%) attend a private institution, while the remaining 395 (92.5%) are enrolled in public schools. The age group of 20 to 24 year olds has the highest likelihood of being enrolled in private schools, with 32 (71.1% in the age bracket) enrolled. Conversely, the age group of 5 to 9 year old has the lowest likelihood of being enrolled in a private school, with 121 (100.0% in the age bracket) attending a public institution.
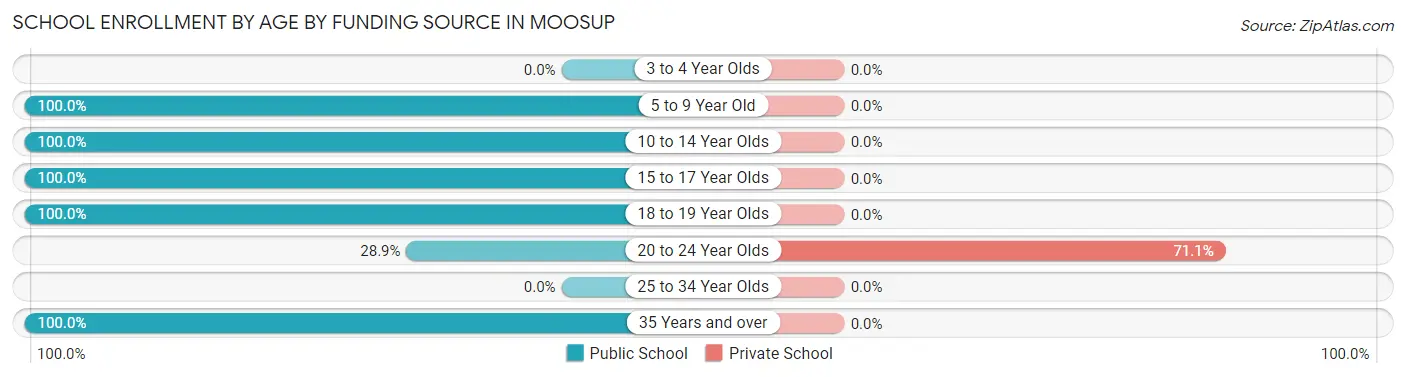
| Age Bracket | Public School | Private School |
| 3 to 4 Year Olds | 0 (0.0%) | 0 (0.0%) |
| 5 to 9 Year Old | 121 (100.0%) | 0 (0.0%) |
| 10 to 14 Year Olds | 61 (100.0%) | 0 (0.0%) |
| 15 to 17 Year Olds | 171 (100.0%) | 0 (0.0%) |
| 18 to 19 Year Olds | 14 (100.0%) | 0 (0.0%) |
| 20 to 24 Year Olds | 13 (28.9%) | 32 (71.1%) |
| 25 to 34 Year Olds | 0 (0.0%) | 0 (0.0%) |
| 35 Years and over | 15 (100.0%) | 0 (0.0%) |
| Total | 395 (92.5%) | 32 (7.5%) |
Educational Attainment by Field of Study in Moosup
Business (103 | 33.8%), communications (40 | 13.1%), science & technology (32 | 10.5%), social sciences (29 | 9.5%), and visual & performing arts (26 | 8.5%) are the most common fields of study among 305 individuals in Moosup who have obtained a bachelor's degree or higher.
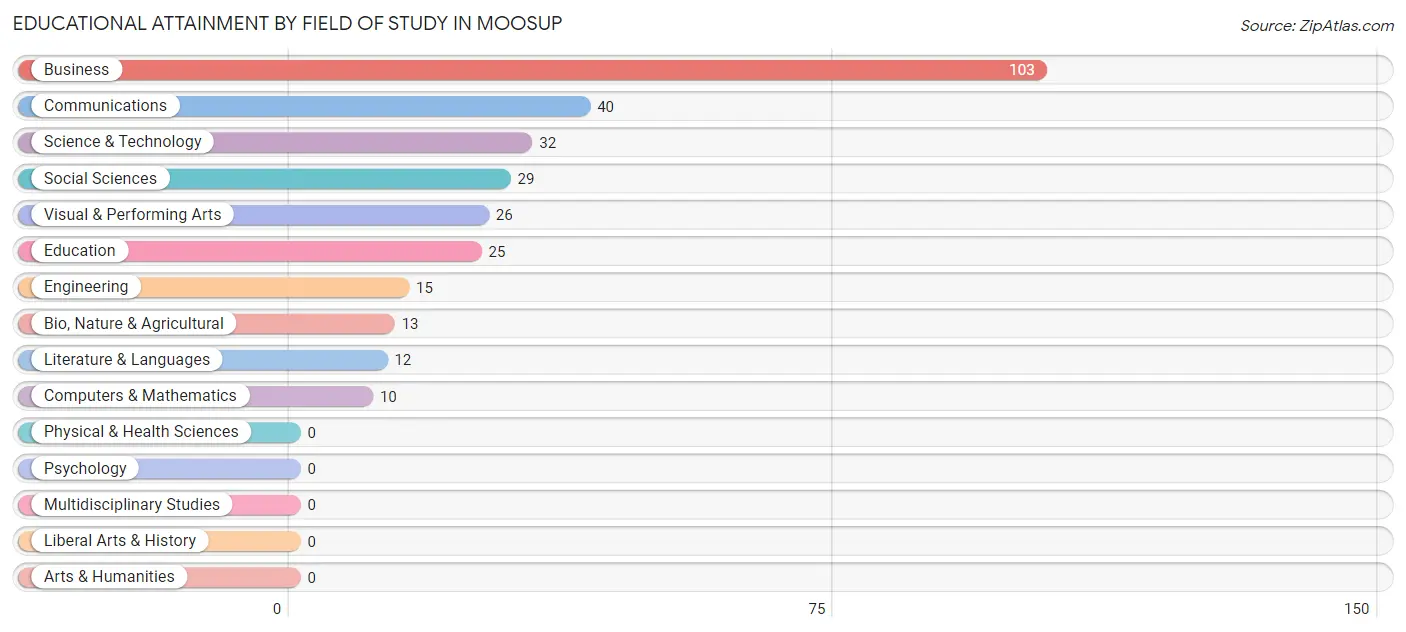
| Field of Study | # Graduates | % Graduates |
| Computers & Mathematics | 10 | 3.3% |
| Bio, Nature & Agricultural | 13 | 4.3% |
| Physical & Health Sciences | 0 | 0.0% |
| Psychology | 0 | 0.0% |
| Social Sciences | 29 | 9.5% |
| Engineering | 15 | 4.9% |
| Multidisciplinary Studies | 0 | 0.0% |
| Science & Technology | 32 | 10.5% |
| Business | 103 | 33.8% |
| Education | 25 | 8.2% |
| Literature & Languages | 12 | 3.9% |
| Liberal Arts & History | 0 | 0.0% |
| Visual & Performing Arts | 26 | 8.5% |
| Communications | 40 | 13.1% |
| Arts & Humanities | 0 | 0.0% |
| Total | 305 | 100.0% |
Transportation & Commute in Moosup
Vehicle Availability by Sex in Moosup
The most prevalent vehicle ownership categories in Moosup are males with 2 vehicles (360, accounting for 37.9%) and females with 2 vehicles (259, making up 53.4%).
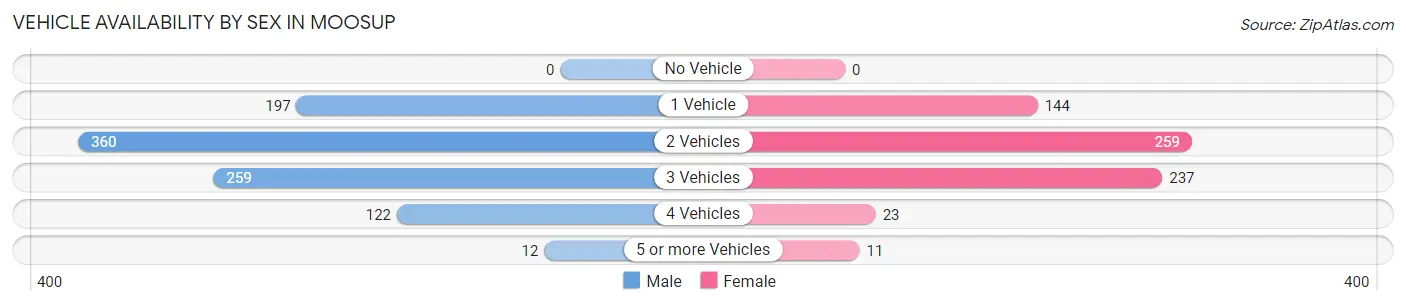
| Vehicles Available | Male | Female |
| No Vehicle | 0 (0.0%) | 0 (0.0%) |
| 1 Vehicle | 197 (20.7%) | 144 (21.4%) |
| 2 Vehicles | 360 (37.9%) | 259 (38.4%) |
| 3 Vehicles | 259 (27.3%) | 237 (35.2%) |
| 4 Vehicles | 122 (12.8%) | 23 (3.4%) |
| 5 or more Vehicles | 12 (1.3%) | 11 (1.6%) |
| Total | 950 (100.0%) | 674 (100.0%) |
Commute Time in Moosup
The most frequently occuring commute durations in Moosup are 5 to 9 minutes (233 commuters, 15.5%), 20 to 24 minutes (228 commuters, 15.2%), and 15 to 19 minutes (204 commuters, 13.6%).
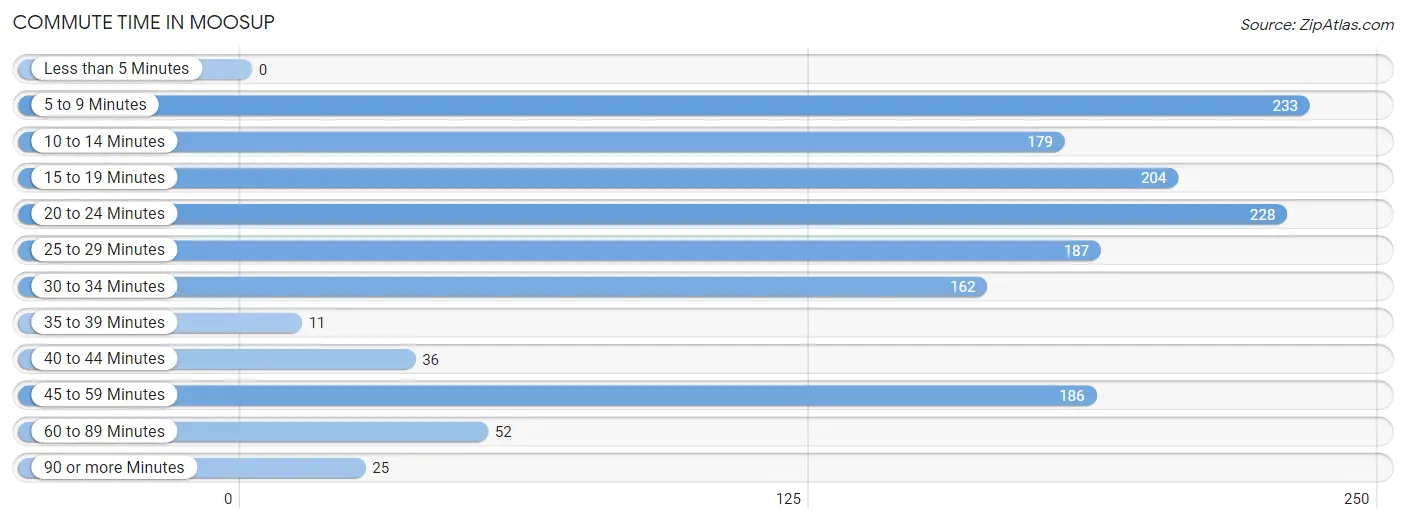
| Commute Time | # Commuters | % Commuters |
| Less than 5 Minutes | 0 | 0.0% |
| 5 to 9 Minutes | 233 | 15.5% |
| 10 to 14 Minutes | 179 | 11.9% |
| 15 to 19 Minutes | 204 | 13.6% |
| 20 to 24 Minutes | 228 | 15.2% |
| 25 to 29 Minutes | 187 | 12.4% |
| 30 to 34 Minutes | 162 | 10.8% |
| 35 to 39 Minutes | 11 | 0.7% |
| 40 to 44 Minutes | 36 | 2.4% |
| 45 to 59 Minutes | 186 | 12.4% |
| 60 to 89 Minutes | 52 | 3.5% |
| 90 or more Minutes | 25 | 1.7% |
Commute Time by Sex in Moosup
The most common commute times in Moosup are 10 to 14 minutes (166 commuters, 18.2%) for males and 20 to 24 minutes (123 commuters, 20.8%) for females.
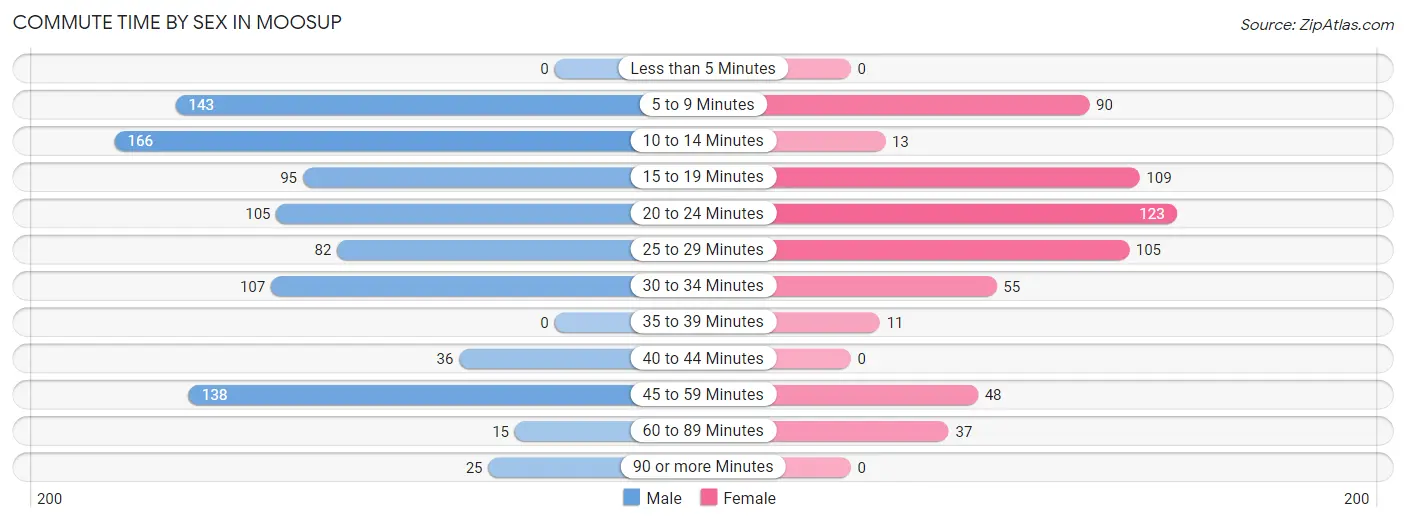
| Commute Time | Male | Female |
| Less than 5 Minutes | 0 (0.0%) | 0 (0.0%) |
| 5 to 9 Minutes | 143 (15.7%) | 90 (15.2%) |
| 10 to 14 Minutes | 166 (18.2%) | 13 (2.2%) |
| 15 to 19 Minutes | 95 (10.4%) | 109 (18.4%) |
| 20 to 24 Minutes | 105 (11.5%) | 123 (20.8%) |
| 25 to 29 Minutes | 82 (9.0%) | 105 (17.8%) |
| 30 to 34 Minutes | 107 (11.7%) | 55 (9.3%) |
| 35 to 39 Minutes | 0 (0.0%) | 11 (1.9%) |
| 40 to 44 Minutes | 36 (4.0%) | 0 (0.0%) |
| 45 to 59 Minutes | 138 (15.1%) | 48 (8.1%) |
| 60 to 89 Minutes | 15 (1.6%) | 37 (6.3%) |
| 90 or more Minutes | 25 (2.7%) | 0 (0.0%) |
Time of Departure to Work by Sex in Moosup
The most frequent times of departure to work in Moosup are 12:00 PM to 3:59 PM (168, 18.4%) for males and 7:00 AM to 7:29 AM (199, 33.7%) for females.
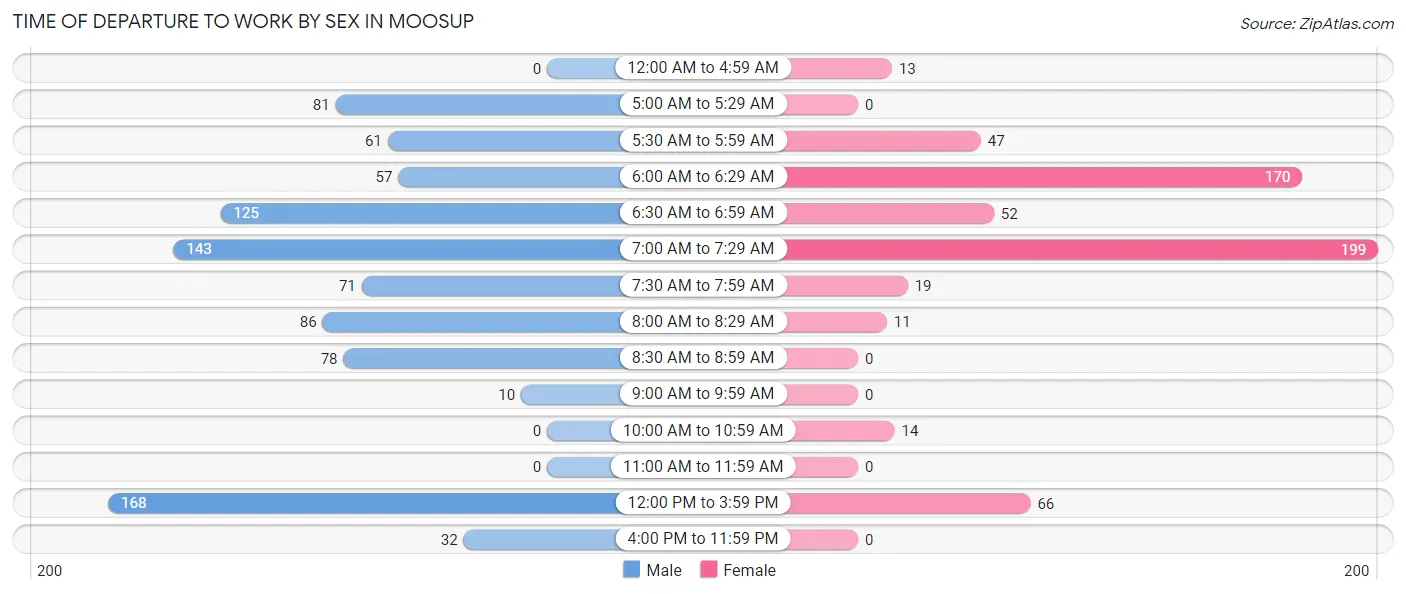
| Time of Departure | Male | Female |
| 12:00 AM to 4:59 AM | 0 (0.0%) | 13 (2.2%) |
| 5:00 AM to 5:29 AM | 81 (8.9%) | 0 (0.0%) |
| 5:30 AM to 5:59 AM | 61 (6.7%) | 47 (8.0%) |
| 6:00 AM to 6:29 AM | 57 (6.2%) | 170 (28.8%) |
| 6:30 AM to 6:59 AM | 125 (13.7%) | 52 (8.8%) |
| 7:00 AM to 7:29 AM | 143 (15.7%) | 199 (33.7%) |
| 7:30 AM to 7:59 AM | 71 (7.8%) | 19 (3.2%) |
| 8:00 AM to 8:29 AM | 86 (9.4%) | 11 (1.9%) |
| 8:30 AM to 8:59 AM | 78 (8.6%) | 0 (0.0%) |
| 9:00 AM to 9:59 AM | 10 (1.1%) | 0 (0.0%) |
| 10:00 AM to 10:59 AM | 0 (0.0%) | 14 (2.4%) |
| 11:00 AM to 11:59 AM | 0 (0.0%) | 0 (0.0%) |
| 12:00 PM to 3:59 PM | 168 (18.4%) | 66 (11.2%) |
| 4:00 PM to 11:59 PM | 32 (3.5%) | 0 (0.0%) |
| Total | 912 (100.0%) | 591 (100.0%) |
Housing Occupancy in Moosup
Occupancy by Ownership in Moosup
Of the total 1,269 dwellings in Moosup, owner-occupied units account for 740 (58.3%), while renter-occupied units make up 529 (41.7%).
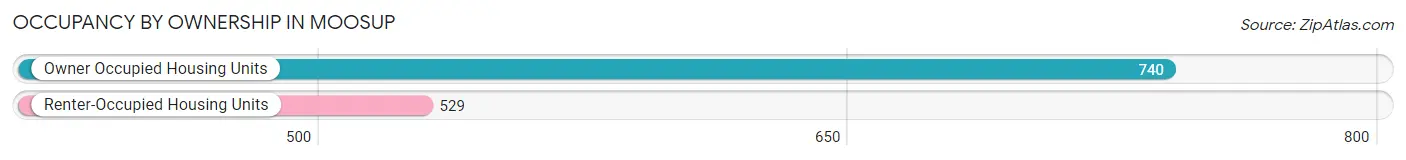
| Occupancy | # Housing Units | % Housing Units |
| Owner Occupied Housing Units | 740 | 58.3% |
| Renter-Occupied Housing Units | 529 | 41.7% |
| Total Occupied Housing Units | 1,269 | 100.0% |
Occupancy by Household Size in Moosup
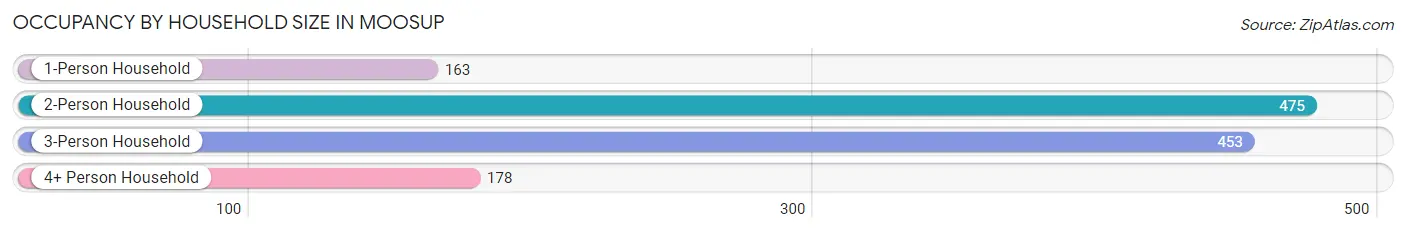
| Household Size | # Housing Units | % Housing Units |
| 1-Person Household | 163 | 12.8% |
| 2-Person Household | 475 | 37.4% |
| 3-Person Household | 453 | 35.7% |
| 4+ Person Household | 178 | 14.0% |
| Total Housing Units | 1,269 | 100.0% |
Occupancy by Ownership by Household Size in Moosup
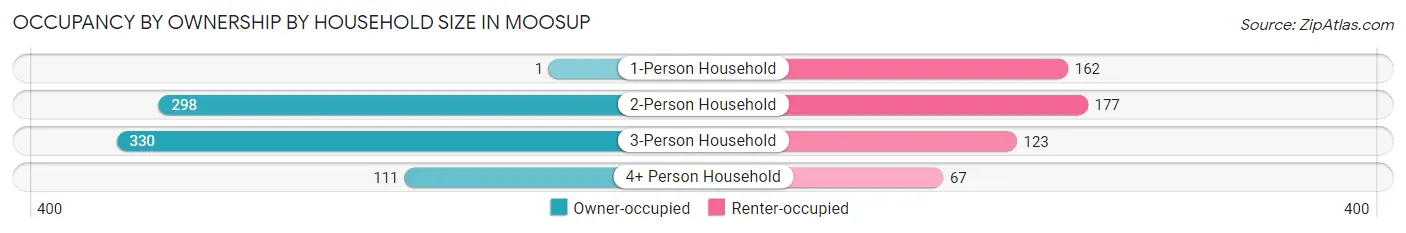
| Household Size | Owner-occupied | Renter-occupied |
| 1-Person Household | 1 (0.6%) | 162 (99.4%) |
| 2-Person Household | 298 (62.7%) | 177 (37.3%) |
| 3-Person Household | 330 (72.9%) | 123 (27.2%) |
| 4+ Person Household | 111 (62.4%) | 67 (37.6%) |
| Total Housing Units | 740 (58.3%) | 529 (41.7%) |
Occupancy by Educational Attainment in Moosup
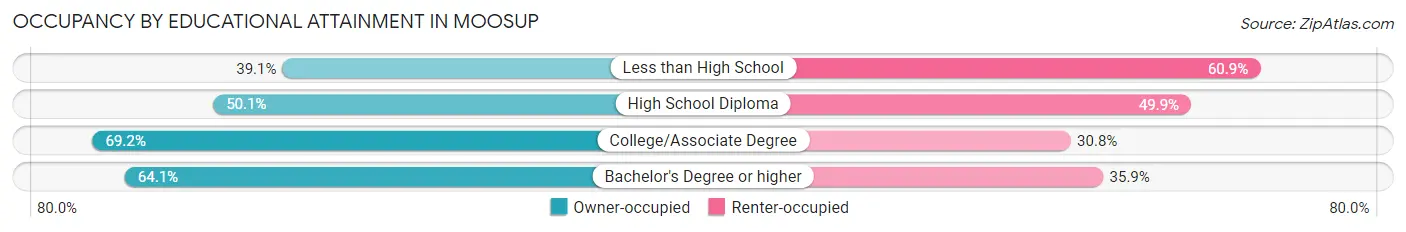
| Household Size | Owner-occupied | Renter-occupied |
| Less than High School | 9 (39.1%) | 14 (60.9%) |
| High School Diploma | 325 (50.1%) | 324 (49.9%) |
| College/Associate Degree | 315 (69.2%) | 140 (30.8%) |
| Bachelor's Degree or higher | 91 (64.1%) | 51 (35.9%) |
Occupancy by Age of Householder in Moosup
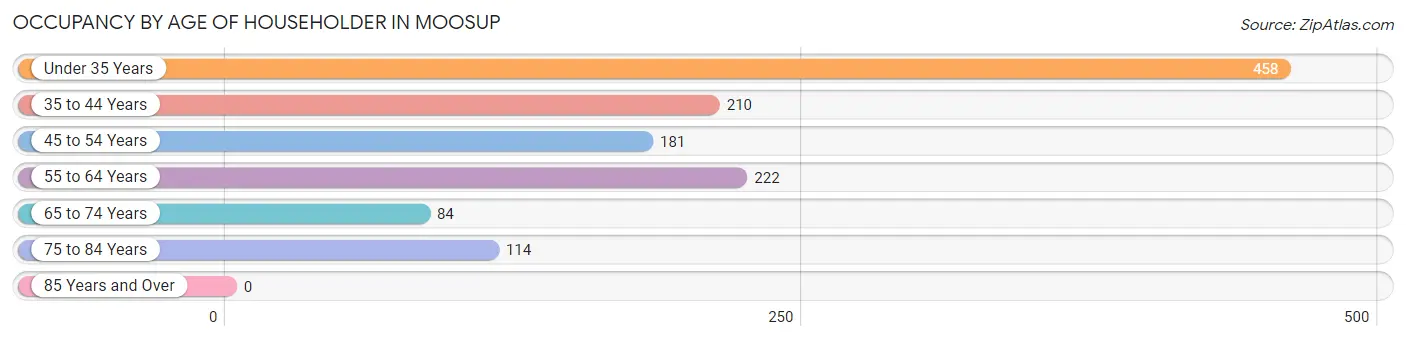
| Age Bracket | # Households | % Households |
| Under 35 Years | 458 | 36.1% |
| 35 to 44 Years | 210 | 16.6% |
| 45 to 54 Years | 181 | 14.3% |
| 55 to 64 Years | 222 | 17.5% |
| 65 to 74 Years | 84 | 6.6% |
| 75 to 84 Years | 114 | 9.0% |
| 85 Years and Over | 0 | 0.0% |
| Total | 1,269 | 100.0% |
Housing Finances in Moosup
Median Income by Occupancy in Moosup
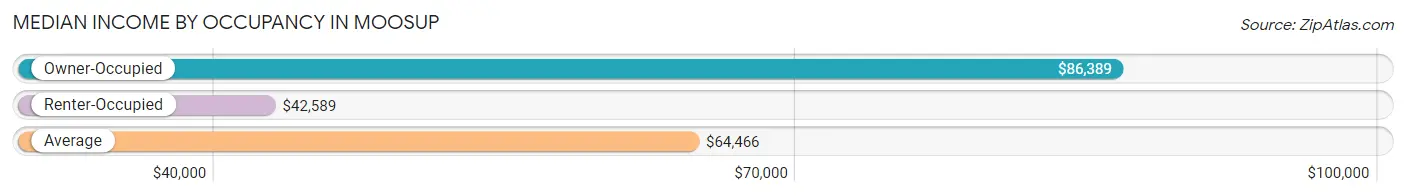
| Occupancy Type | # Households | Median Income |
| Owner-Occupied | 740 (58.3%) | $86,389 |
| Renter-Occupied | 529 (41.7%) | $42,589 |
| Average | 1,269 (100.0%) | $64,466 |
Occupancy by Householder Income Bracket in Moosup
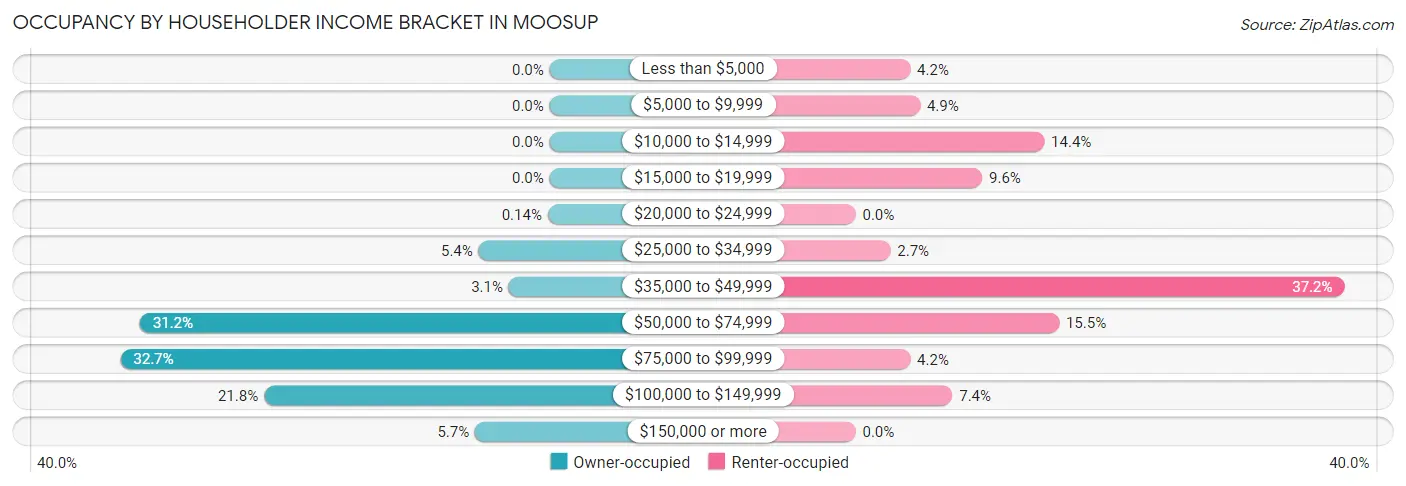
| Income Bracket | Owner-occupied | Renter-occupied |
| Less than $5,000 | 0 (0.0%) | 22 (4.2%) |
| $5,000 to $9,999 | 0 (0.0%) | 26 (4.9%) |
| $10,000 to $14,999 | 0 (0.0%) | 76 (14.4%) |
| $15,000 to $19,999 | 0 (0.0%) | 51 (9.6%) |
| $20,000 to $24,999 | 1 (0.1%) | 0 (0.0%) |
| $25,000 to $34,999 | 40 (5.4%) | 14 (2.6%) |
| $35,000 to $49,999 | 23 (3.1%) | 197 (37.2%) |
| $50,000 to $74,999 | 231 (31.2%) | 82 (15.5%) |
| $75,000 to $99,999 | 242 (32.7%) | 22 (4.2%) |
| $100,000 to $149,999 | 161 (21.8%) | 39 (7.4%) |
| $150,000 or more | 42 (5.7%) | 0 (0.0%) |
| Total | 740 (100.0%) | 529 (100.0%) |
Monthly Housing Cost Tiers in Moosup
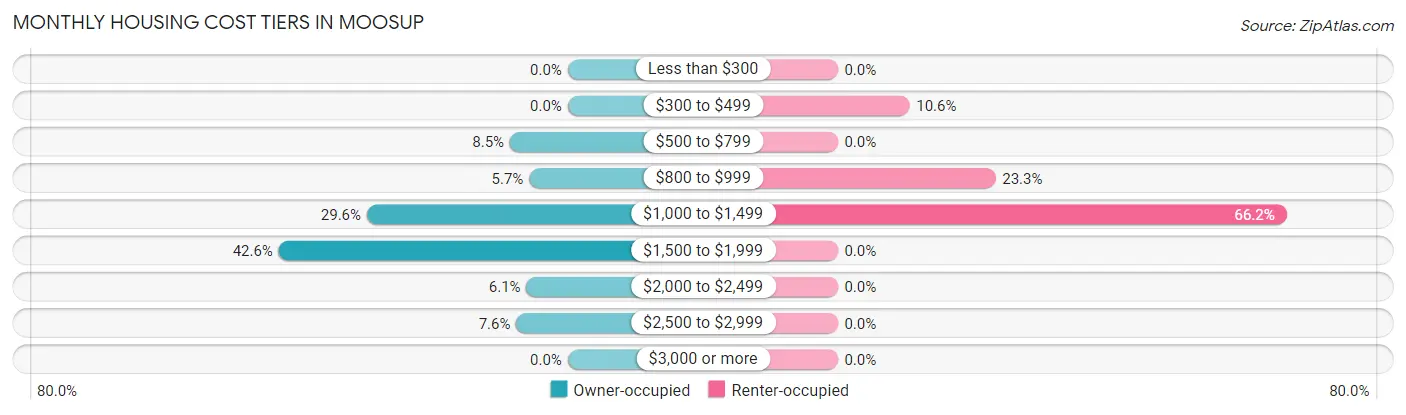
| Monthly Cost | Owner-occupied | Renter-occupied |
| Less than $300 | 0 (0.0%) | 0 (0.0%) |
| $300 to $499 | 0 (0.0%) | 56 (10.6%) |
| $500 to $799 | 63 (8.5%) | 0 (0.0%) |
| $800 to $999 | 42 (5.7%) | 123 (23.3%) |
| $1,000 to $1,499 | 219 (29.6%) | 350 (66.2%) |
| $1,500 to $1,999 | 315 (42.6%) | 0 (0.0%) |
| $2,000 to $2,499 | 45 (6.1%) | 0 (0.0%) |
| $2,500 to $2,999 | 56 (7.6%) | 0 (0.0%) |
| $3,000 or more | 0 (0.0%) | 0 (0.0%) |
| Total | 740 (100.0%) | 529 (100.0%) |
Physical Housing Characteristics in Moosup
Housing Structures in Moosup
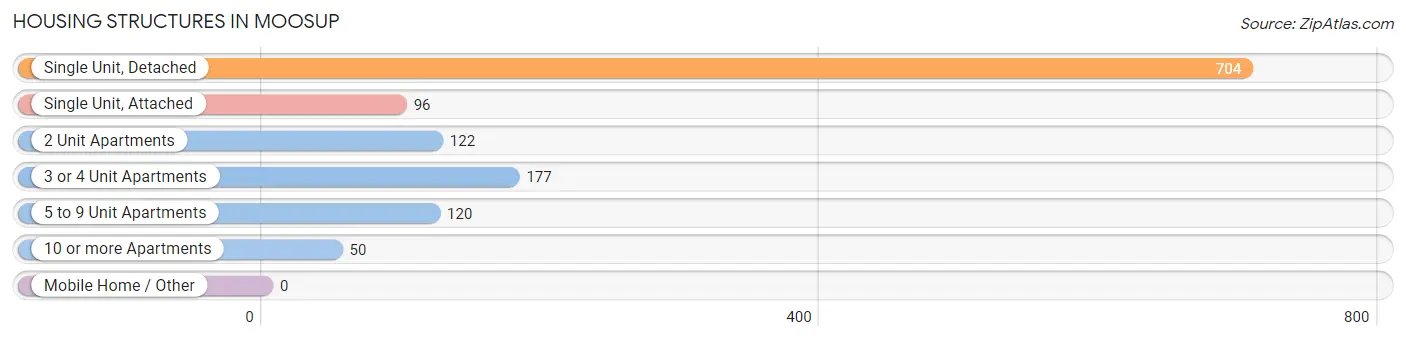
| Structure Type | # Housing Units | % Housing Units |
| Single Unit, Detached | 704 | 55.5% |
| Single Unit, Attached | 96 | 7.6% |
| 2 Unit Apartments | 122 | 9.6% |
| 3 or 4 Unit Apartments | 177 | 14.0% |
| 5 to 9 Unit Apartments | 120 | 9.5% |
| 10 or more Apartments | 50 | 3.9% |
| Mobile Home / Other | 0 | 0.0% |
| Total | 1,269 | 100.0% |
Housing Structures by Occupancy in Moosup
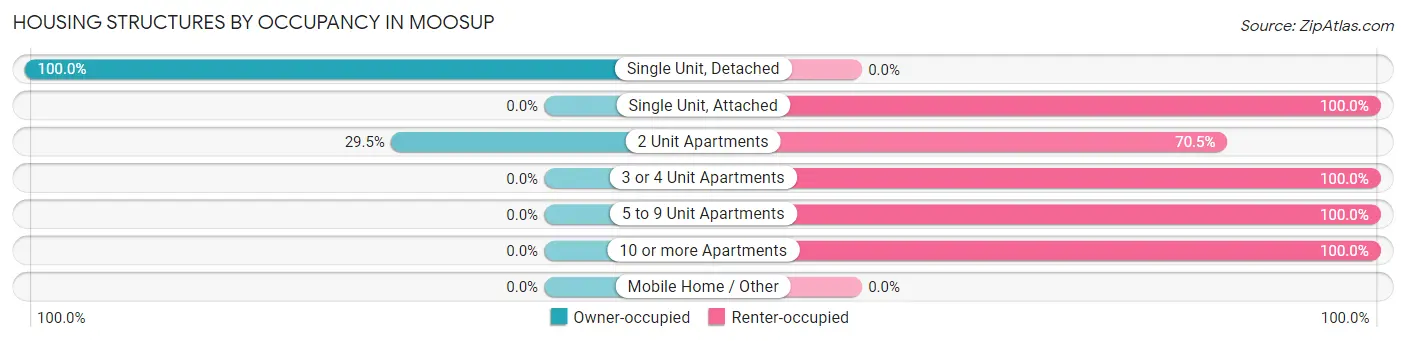
| Structure Type | Owner-occupied | Renter-occupied |
| Single Unit, Detached | 704 (100.0%) | 0 (0.0%) |
| Single Unit, Attached | 0 (0.0%) | 96 (100.0%) |
| 2 Unit Apartments | 36 (29.5%) | 86 (70.5%) |
| 3 or 4 Unit Apartments | 0 (0.0%) | 177 (100.0%) |
| 5 to 9 Unit Apartments | 0 (0.0%) | 120 (100.0%) |
| 10 or more Apartments | 0 (0.0%) | 50 (100.0%) |
| Mobile Home / Other | 0 (0.0%) | 0 (0.0%) |
| Total | 740 (58.3%) | 529 (41.7%) |
Housing Structures by Number of Rooms in Moosup
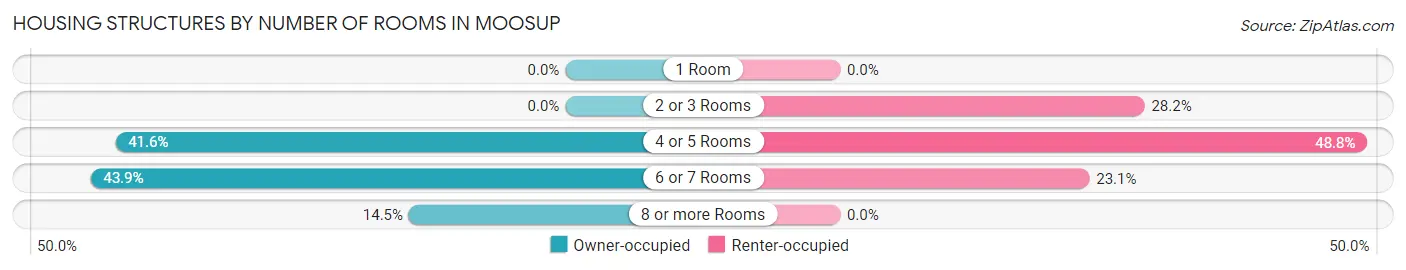
| Number of Rooms | Owner-occupied | Renter-occupied |
| 1 Room | 0 (0.0%) | 0 (0.0%) |
| 2 or 3 Rooms | 0 (0.0%) | 149 (28.2%) |
| 4 or 5 Rooms | 308 (41.6%) | 258 (48.8%) |
| 6 or 7 Rooms | 325 (43.9%) | 122 (23.1%) |
| 8 or more Rooms | 107 (14.5%) | 0 (0.0%) |
| Total | 740 (100.0%) | 529 (100.0%) |
Housing Structure by Heating Type in Moosup
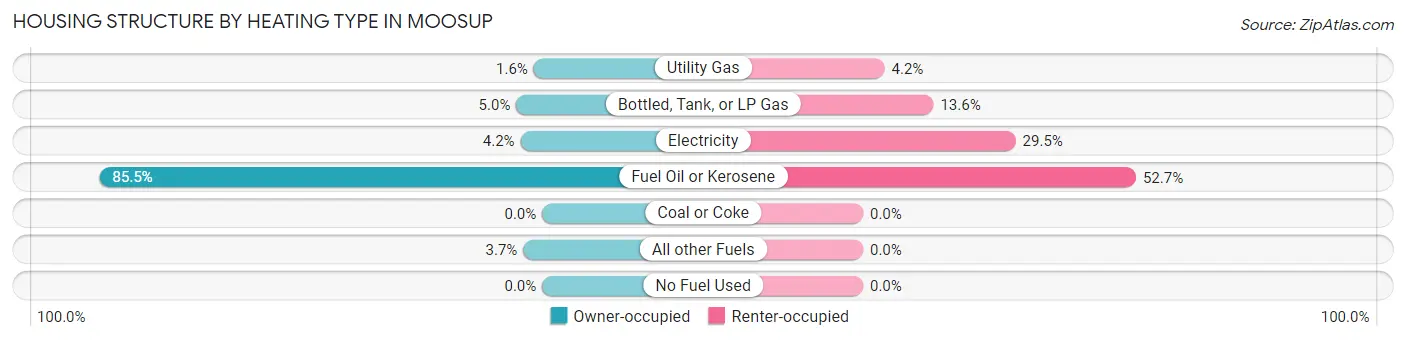
| Heating Type | Owner-occupied | Renter-occupied |
| Utility Gas | 12 (1.6%) | 22 (4.2%) |
| Bottled, Tank, or LP Gas | 37 (5.0%) | 72 (13.6%) |
| Electricity | 31 (4.2%) | 156 (29.5%) |
| Fuel Oil or Kerosene | 633 (85.5%) | 279 (52.7%) |
| Coal or Coke | 0 (0.0%) | 0 (0.0%) |
| All other Fuels | 27 (3.6%) | 0 (0.0%) |
| No Fuel Used | 0 (0.0%) | 0 (0.0%) |
| Total | 740 (100.0%) | 529 (100.0%) |
Household Vehicle Usage in Moosup
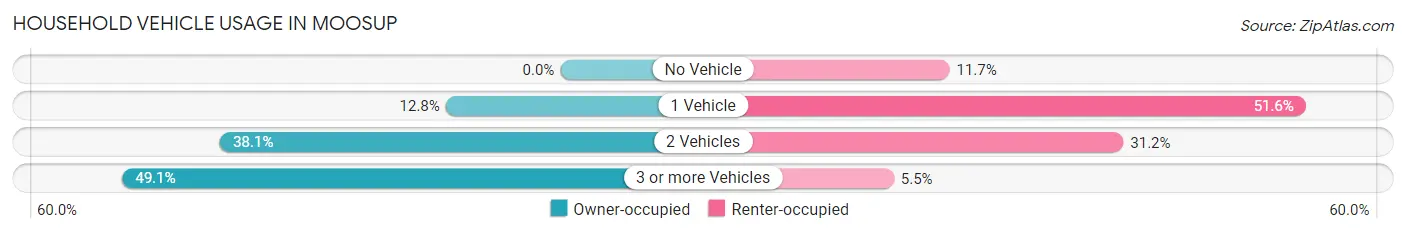
| Vehicles per Household | Owner-occupied | Renter-occupied |
| No Vehicle | 0 (0.0%) | 62 (11.7%) |
| 1 Vehicle | 95 (12.8%) | 273 (51.6%) |
| 2 Vehicles | 282 (38.1%) | 165 (31.2%) |
| 3 or more Vehicles | 363 (49.0%) | 29 (5.5%) |
| Total | 740 (100.0%) | 529 (100.0%) |
Real Estate & Mortgages in Moosup
Real Estate and Mortgage Overview in Moosup
| Characteristic | Without Mortgage | With Mortgage |
| Housing Units | 138 | 602 |
| Median Property Value | $226,900 | $221,000 |
| Median Household Income | $73,333 | $26 |
| Monthly Housing Costs | $818 | $0 |
| Real Estate Taxes | $3,683 | $0 |
Property Value by Mortgage Status in Moosup
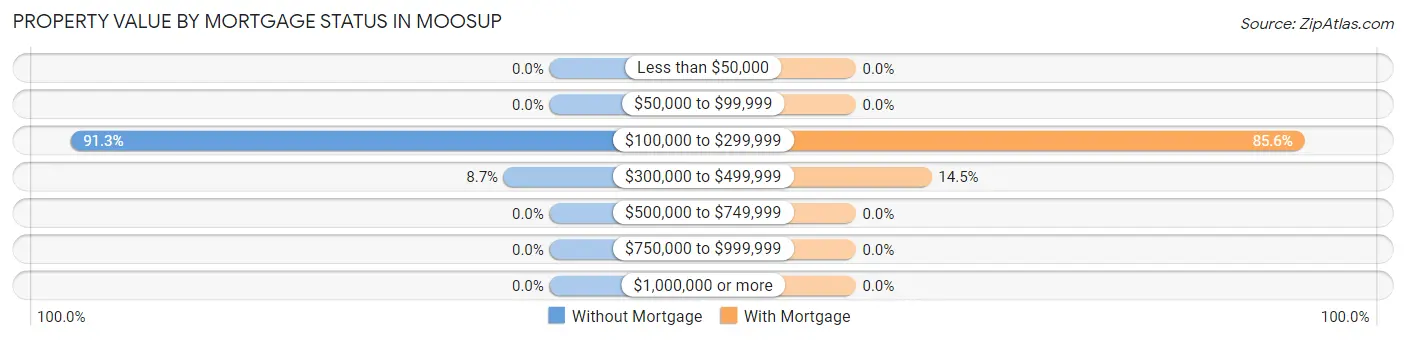
| Property Value | Without Mortgage | With Mortgage |
| Less than $50,000 | 0 (0.0%) | 0 (0.0%) |
| $50,000 to $99,999 | 0 (0.0%) | 0 (0.0%) |
| $100,000 to $299,999 | 126 (91.3%) | 515 (85.6%) |
| $300,000 to $499,999 | 12 (8.7%) | 87 (14.4%) |
| $500,000 to $749,999 | 0 (0.0%) | 0 (0.0%) |
| $750,000 to $999,999 | 0 (0.0%) | 0 (0.0%) |
| $1,000,000 or more | 0 (0.0%) | 0 (0.0%) |
| Total | 138 (100.0%) | 602 (100.0%) |
Household Income by Mortgage Status in Moosup
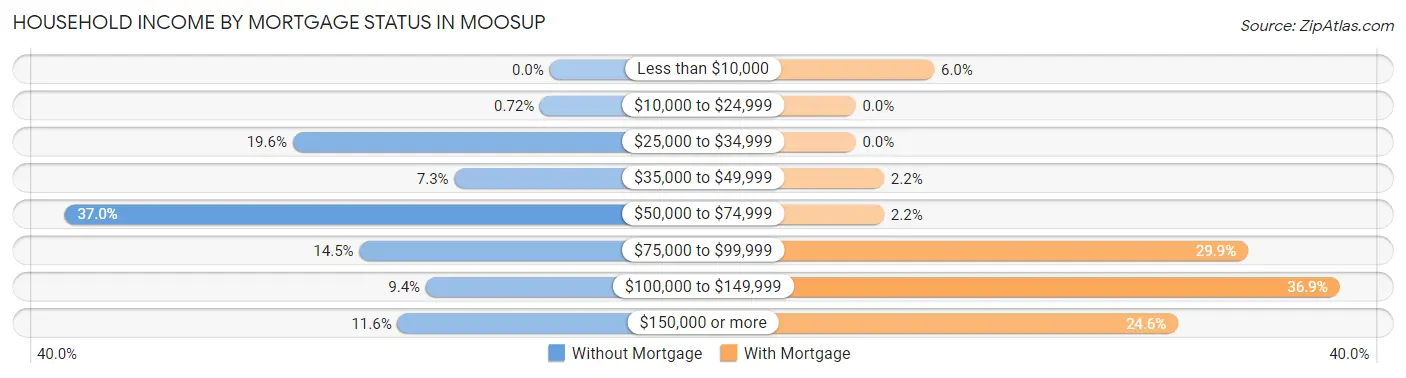
| Household Income | Without Mortgage | With Mortgage |
| Less than $10,000 | 0 (0.0%) | 36 (6.0%) |
| $10,000 to $24,999 | 1 (0.7%) | 0 (0.0%) |
| $25,000 to $34,999 | 27 (19.6%) | 0 (0.0%) |
| $35,000 to $49,999 | 10 (7.2%) | 13 (2.2%) |
| $50,000 to $74,999 | 51 (37.0%) | 13 (2.2%) |
| $75,000 to $99,999 | 20 (14.5%) | 180 (29.9%) |
| $100,000 to $149,999 | 13 (9.4%) | 222 (36.9%) |
| $150,000 or more | 16 (11.6%) | 148 (24.6%) |
| Total | 138 (100.0%) | 602 (100.0%) |
Property Value to Household Income Ratio in Moosup
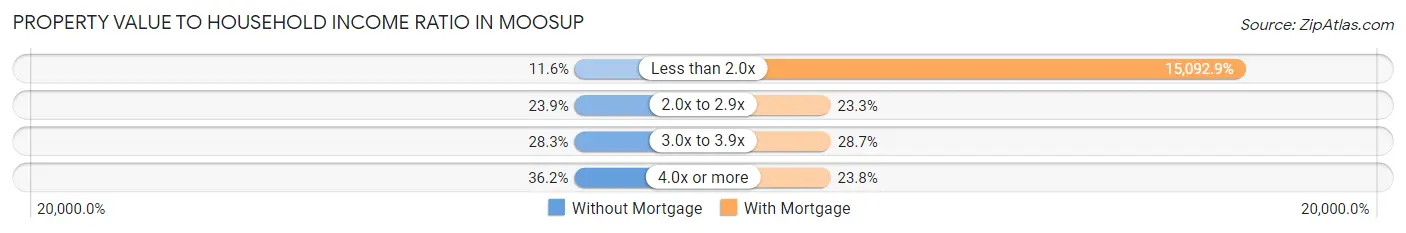
| Value-to-Income Ratio | Without Mortgage | With Mortgage |
| Less than 2.0x | 16 (11.6%) | 90,859 (15,092.9%) |
| 2.0x to 2.9x | 33 (23.9%) | 140 (23.3%) |
| 3.0x to 3.9x | 39 (28.3%) | 173 (28.7%) |
| 4.0x or more | 50 (36.2%) | 143 (23.7%) |
| Total | 138 (100.0%) | 602 (100.0%) |
Real Estate Taxes by Mortgage Status in Moosup
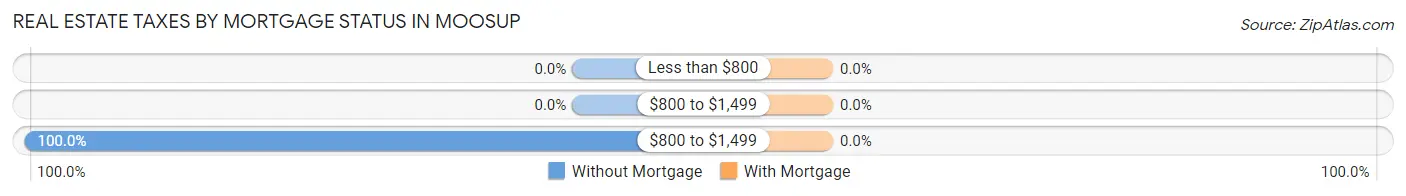
| Property Taxes | Without Mortgage | With Mortgage |
| Less than $800 | 0 (0.0%) | 0 (0.0%) |
| $800 to $1,499 | 0 (0.0%) | 0 (0.0%) |
| $800 to $1,499 | 138 (100.0%) | 0 (0.0%) |
| Total | 138 (100.0%) | 602 (100.0%) |
Health & Disability in Moosup
Health Insurance Coverage by Age in Moosup
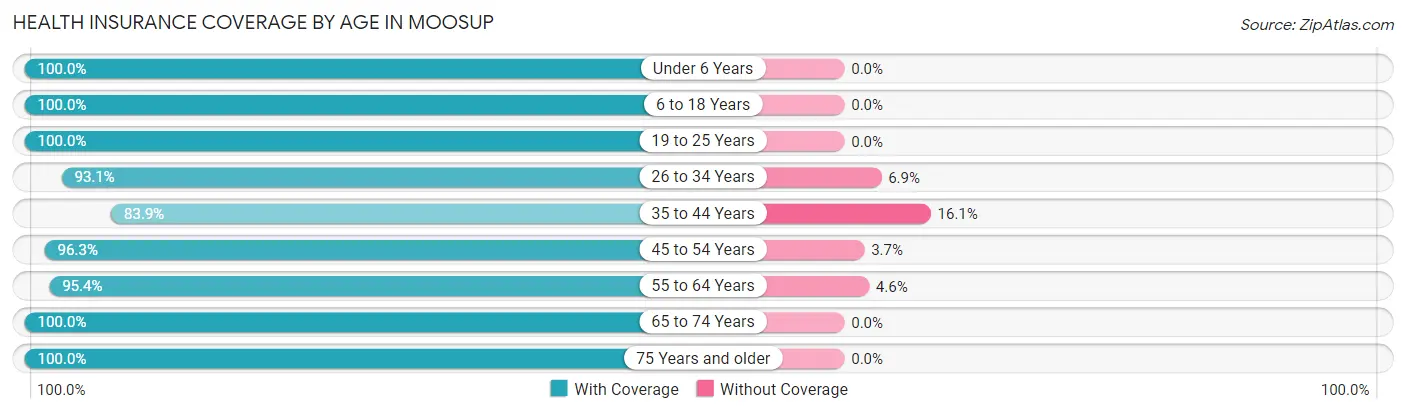
| Age Bracket | With Coverage | Without Coverage |
| Under 6 Years | 299 (100.0%) | 0 (0.0%) |
| 6 to 18 Years | 395 (100.0%) | 0 (0.0%) |
| 19 to 25 Years | 288 (100.0%) | 0 (0.0%) |
| 26 to 34 Years | 717 (93.1%) | 53 (6.9%) |
| 35 to 44 Years | 297 (83.9%) | 57 (16.1%) |
| 45 to 54 Years | 285 (96.3%) | 11 (3.7%) |
| 55 to 64 Years | 395 (95.4%) | 19 (4.6%) |
| 65 to 74 Years | 150 (100.0%) | 0 (0.0%) |
| 75 Years and older | 209 (100.0%) | 0 (0.0%) |
| Total | 3,035 (95.6%) | 140 (4.4%) |
Health Insurance Coverage by Citizenship Status in Moosup
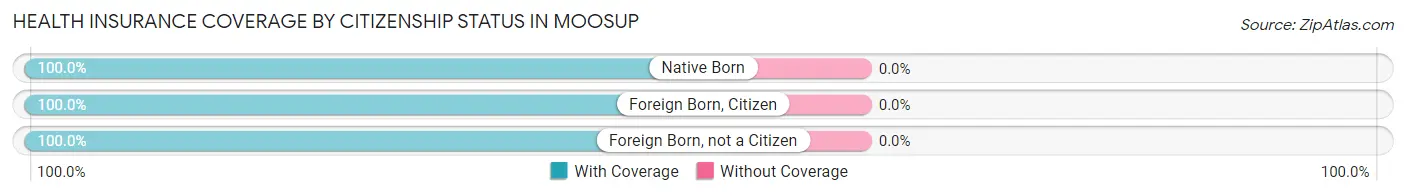
| Citizenship Status | With Coverage | Without Coverage |
| Native Born | 299 (100.0%) | 0 (0.0%) |
| Foreign Born, Citizen | 395 (100.0%) | 0 (0.0%) |
| Foreign Born, not a Citizen | 288 (100.0%) | 0 (0.0%) |
Health Insurance Coverage by Household Income in Moosup
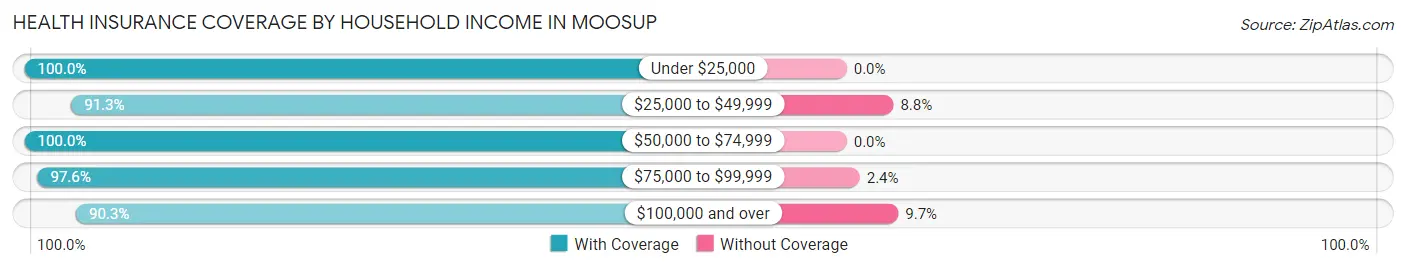
| Household Income | With Coverage | Without Coverage |
| Under $25,000 | 381 (100.0%) | 0 (0.0%) |
| $25,000 to $49,999 | 553 (91.2%) | 53 (8.7%) |
| $50,000 to $74,999 | 745 (100.0%) | 0 (0.0%) |
| $75,000 to $99,999 | 683 (97.6%) | 17 (2.4%) |
| $100,000 and over | 655 (90.3%) | 70 (9.7%) |
Public vs Private Health Insurance Coverage by Age in Moosup
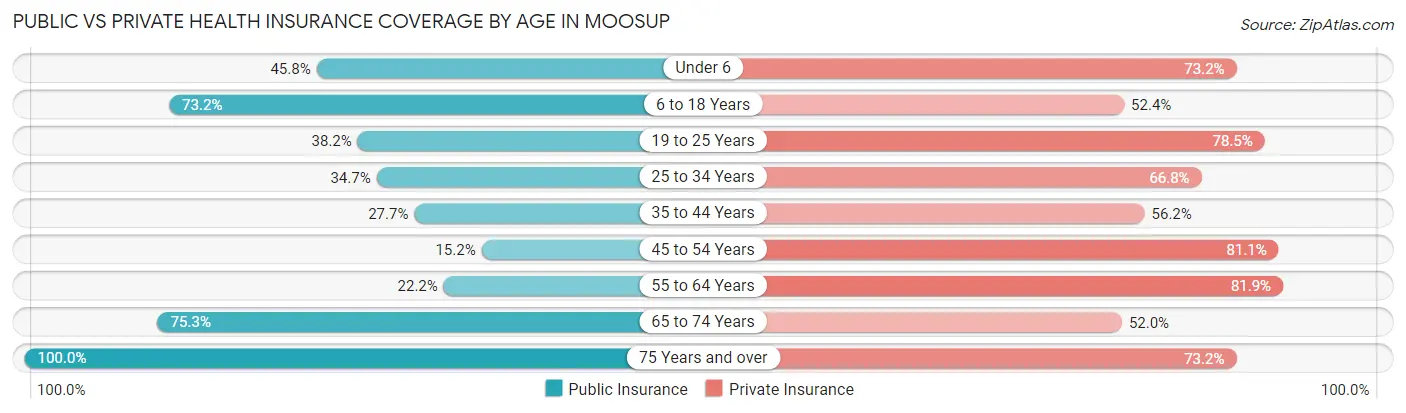
| Age Bracket | Public Insurance | Private Insurance |
| Under 6 | 137 (45.8%) | 219 (73.2%) |
| 6 to 18 Years | 289 (73.2%) | 207 (52.4%) |
| 19 to 25 Years | 110 (38.2%) | 226 (78.5%) |
| 25 to 34 Years | 267 (34.7%) | 514 (66.7%) |
| 35 to 44 Years | 98 (27.7%) | 199 (56.2%) |
| 45 to 54 Years | 45 (15.2%) | 240 (81.1%) |
| 55 to 64 Years | 92 (22.2%) | 339 (81.9%) |
| 65 to 74 Years | 113 (75.3%) | 78 (52.0%) |
| 75 Years and over | 209 (100.0%) | 153 (73.2%) |
| Total | 1,360 (42.8%) | 2,175 (68.5%) |
Disability Status by Sex by Age in Moosup
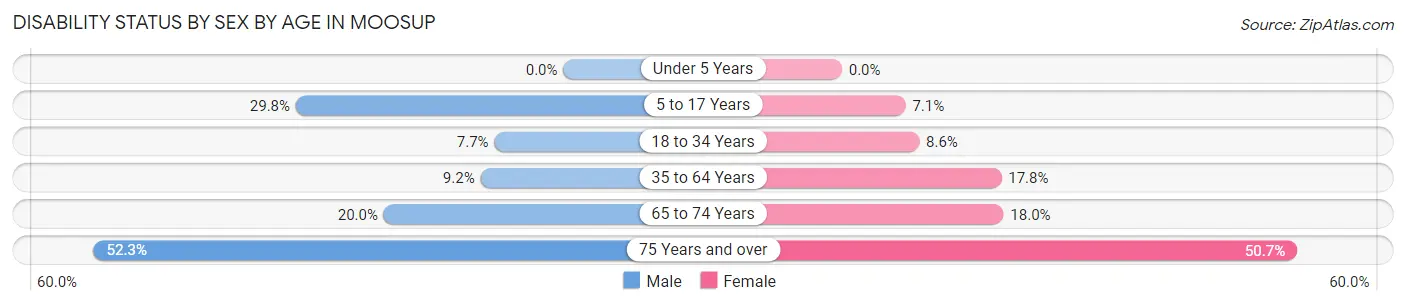
| Age Bracket | Male | Female |
| Under 5 Years | 0 (0.0%) | 0 (0.0%) |
| 5 to 17 Years | 56 (29.8%) | 18 (7.1%) |
| 18 to 34 Years | 42 (7.7%) | 44 (8.6%) |
| 35 to 64 Years | 53 (9.2%) | 87 (17.8%) |
| 65 to 74 Years | 10 (20.0%) | 18 (18.0%) |
| 75 Years and over | 34 (52.3%) | 73 (50.7%) |
Disability Class by Sex by Age in Moosup
Disability Class: Hearing Difficulty
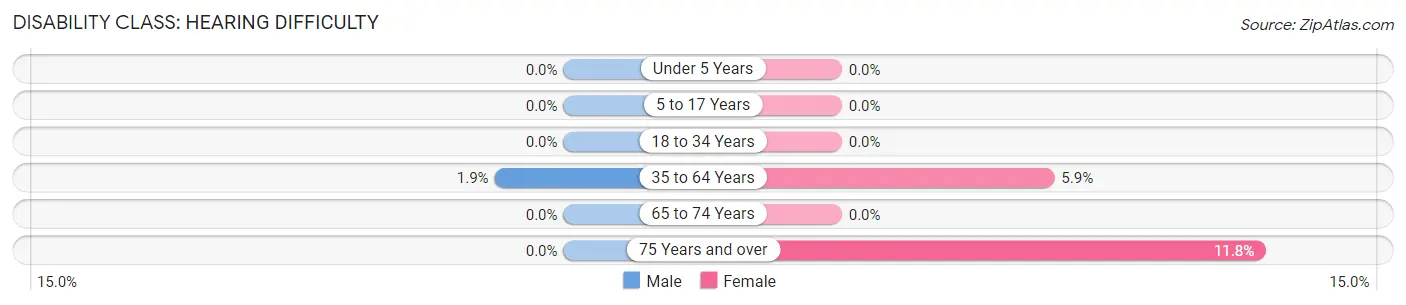
| Age Bracket | Male | Female |
| Under 5 Years | 0 (0.0%) | 0 (0.0%) |
| 5 to 17 Years | 0 (0.0%) | 0 (0.0%) |
| 18 to 34 Years | 0 (0.0%) | 0 (0.0%) |
| 35 to 64 Years | 11 (1.9%) | 29 (5.9%) |
| 65 to 74 Years | 0 (0.0%) | 0 (0.0%) |
| 75 Years and over | 0 (0.0%) | 17 (11.8%) |
Disability Class: Vision Difficulty
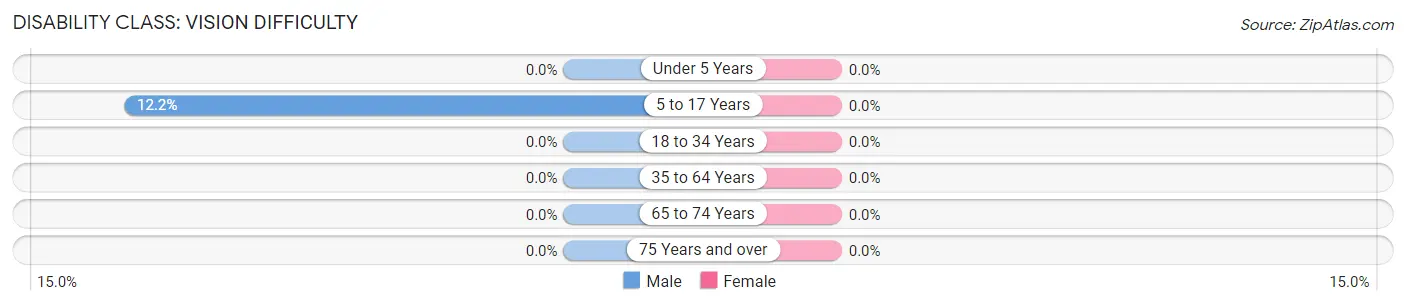
| Age Bracket | Male | Female |
| Under 5 Years | 0 (0.0%) | 0 (0.0%) |
| 5 to 17 Years | 23 (12.2%) | 0 (0.0%) |
| 18 to 34 Years | 0 (0.0%) | 0 (0.0%) |
| 35 to 64 Years | 0 (0.0%) | 0 (0.0%) |
| 65 to 74 Years | 0 (0.0%) | 0 (0.0%) |
| 75 Years and over | 0 (0.0%) | 0 (0.0%) |
Disability Class: Cognitive Difficulty
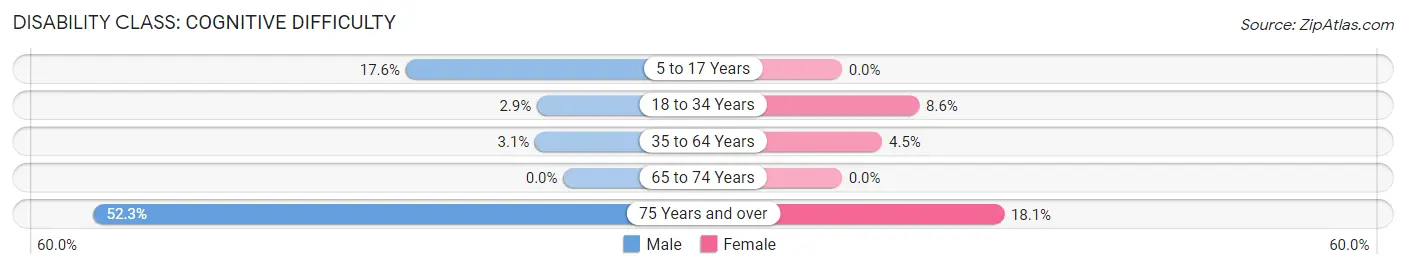
| Age Bracket | Male | Female |
| 5 to 17 Years | 33 (17.5%) | 0 (0.0%) |
| 18 to 34 Years | 16 (2.9%) | 44 (8.6%) |
| 35 to 64 Years | 18 (3.1%) | 22 (4.5%) |
| 65 to 74 Years | 0 (0.0%) | 0 (0.0%) |
| 75 Years and over | 34 (52.3%) | 26 (18.1%) |
Disability Class: Ambulatory Difficulty
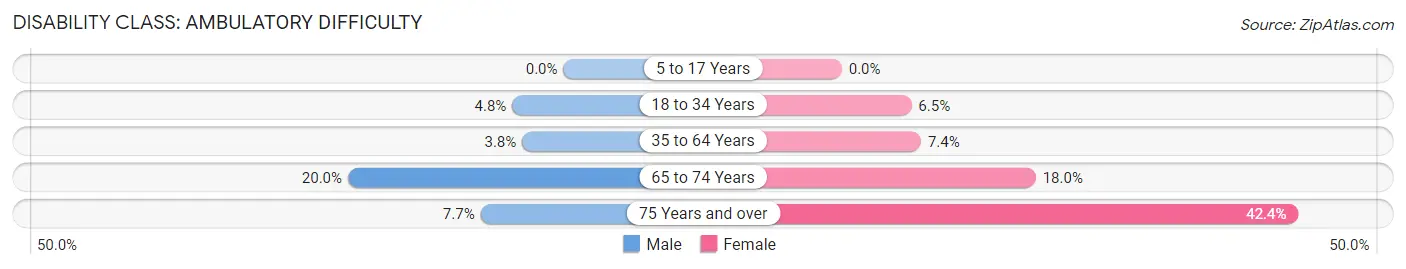
| Age Bracket | Male | Female |
| 5 to 17 Years | 0 (0.0%) | 0 (0.0%) |
| 18 to 34 Years | 26 (4.8%) | 33 (6.5%) |
| 35 to 64 Years | 22 (3.8%) | 36 (7.3%) |
| 65 to 74 Years | 10 (20.0%) | 18 (18.0%) |
| 75 Years and over | 5 (7.7%) | 61 (42.4%) |
Disability Class: Self-Care Difficulty
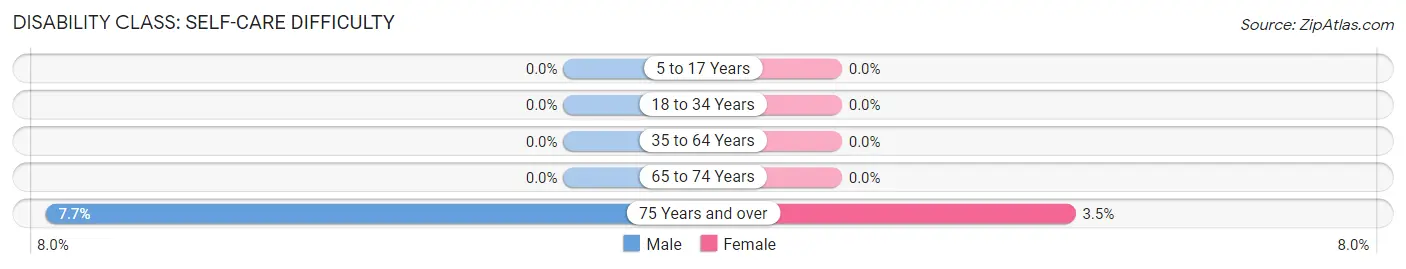
| Age Bracket | Male | Female |
| 5 to 17 Years | 0 (0.0%) | 0 (0.0%) |
| 18 to 34 Years | 0 (0.0%) | 0 (0.0%) |
| 35 to 64 Years | 0 (0.0%) | 0 (0.0%) |
| 65 to 74 Years | 0 (0.0%) | 0 (0.0%) |
| 75 Years and over | 5 (7.7%) | 5 (3.5%) |
Technology Access in Moosup
Computing Device Access in Moosup
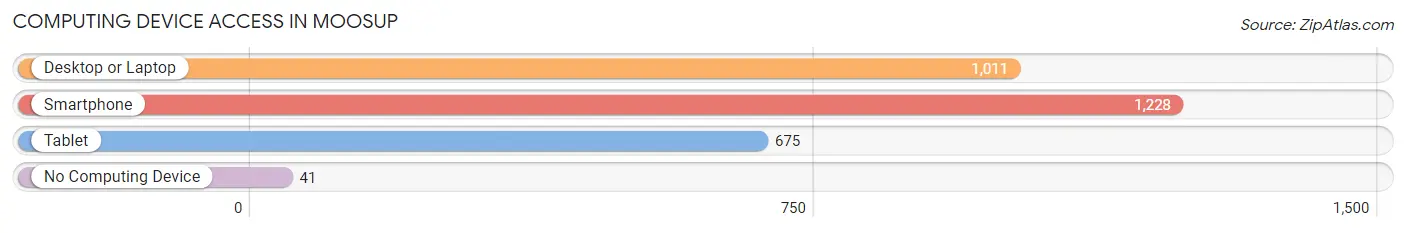
| Device Type | # Households | % Households |
| Desktop or Laptop | 1,011 | 79.7% |
| Smartphone | 1,228 | 96.8% |
| Tablet | 675 | 53.2% |
| No Computing Device | 41 | 3.2% |
| Total | 1,269 | 100.0% |
Internet Access in Moosup
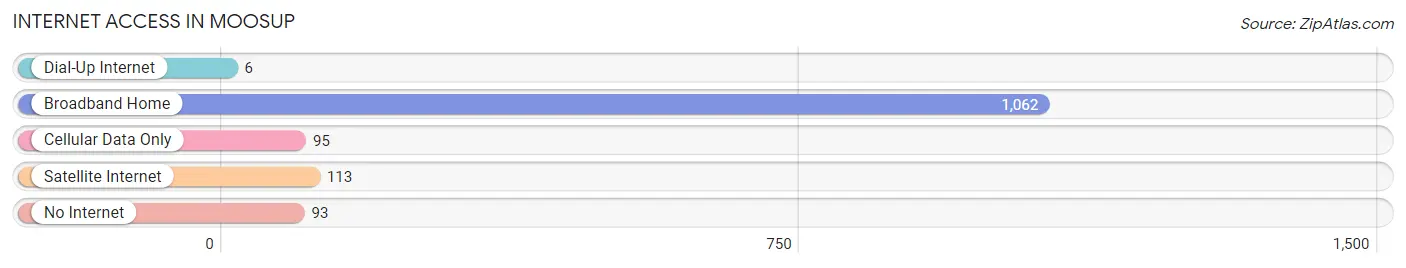
| Internet Type | # Households | % Households |
| Dial-Up Internet | 6 | 0.5% |
| Broadband Home | 1,062 | 83.7% |
| Cellular Data Only | 95 | 7.5% |
| Satellite Internet | 113 | 8.9% |
| No Internet | 93 | 7.3% |
| Total | 1,269 | 100.0% |
Moosup Summary
Moosup is a small village located in the town of Plainfield, Connecticut, in the United States. It is situated in the northeastern corner of the state, near the Rhode Island border. The village is home to a population of approximately 1,500 people, and is part of the larger Norwich-New London-Westerly metropolitan area.
History
Moosup was first settled in 1710 by a group of settlers from Rhode Island. The village was originally known as “Moosup Plantation”, and was part of the town of Plainfield. The name “Moosup” is derived from the Mohegan word “Moosup”, which means “place of the beaver”. The village was incorporated in 1871, and has remained relatively unchanged since then.
Geography
Moosup is located in the northeastern corner of Connecticut, near the Rhode Island border. The village is situated on the Quinebaug River, and is surrounded by the towns of Plainfield, Sterling, and Canterbury. The village is approximately 10 miles from the city of Norwich, and 30 miles from the city of Hartford.
The village is located in a rural area, and is surrounded by forests and farmland. The terrain is mostly flat, with some rolling hills. The climate is humid continental, with cold winters and hot, humid summers.
Economy
Moosup’s economy is largely based on agriculture and manufacturing. The village is home to several small businesses, including a sawmill, a dairy farm, and a lumber yard. The village also has a small retail sector, with several stores and restaurants.
Demographics
As of the 2010 census, the population of Moosup was 1,521. The racial makeup of the village was 94.3% White, 1.2% African American, 0.3% Native American, 0.7% Asian, 0.1% Pacific Islander, 1.2% from other races, and 2.3% from two or more races. Hispanic or Latino of any race were 3.2% of the population.
The median household income in Moosup was $50,938, and the median family income was $60,938. The per capita income for the village was $22,938. About 8.3% of families and 10.2% of the population were below the poverty line, including 14.2% of those under age 18 and 5.2% of those age 65 or over.
Conclusion
Moosup is a small village located in the northeastern corner of Connecticut, near the Rhode Island border. The village has a population of approximately 1,500 people, and is part of the larger Norwich-New London-Westerly metropolitan area. The village was first settled in 1710, and has remained relatively unchanged since then. The economy of Moosup is largely based on agriculture and manufacturing, and the village has a small retail sector. The population of Moosup is mostly White, with a small percentage of African American, Native American, Asian, and Pacific Islander residents. The median household income in Moosup is $50,938, and the per capita income is $22,938.
Common Questions
What is Per Capita Income in Moosup?
Per Capita income in Moosup is $27,761.
What is the Median Family Income in Moosup?
Median Family Income in Moosup is $66,613.
What is the Median Household income in Moosup?
Median Household Income in Moosup is $64,466.
What is Income or Wage Gap in Moosup?
Income or Wage Gap in Moosup is 39.3%.
Women in Moosup earn 60.7 cents for every dollar earned by a man.
What is Inequality or Gini Index in Moosup?
Inequality or Gini Index in Moosup is 0.32.
What is the Total Population of Moosup?
Total Population of Moosup is 3,175.
What is the Total Male Population of Moosup?
Total Male Population of Moosup is 1,582.
What is the Total Female Population of Moosup?
Total Female Population of Moosup is 1,593.
What is the Ratio of Males per 100 Females in Moosup?
There are 99.31 Males per 100 Females in Moosup.
What is the Ratio of Females per 100 Males in Moosup?
There are 100.70 Females per 100 Males in Moosup.
What is the Median Population Age in Moosup?
Median Population Age in Moosup is 30.8 Years.
What is the Average Family Size in Moosup
Average Family Size in Moosup is 2.7 People.
What is the Average Household Size in Moosup
Average Household Size in Moosup is 2.5 People.
How Large is the Labor Force in Moosup?
There are 1,832 People in the Labor Forcein in Moosup.
What is the Percentage of People in the Labor Force in Moosup?
69.4% of People are in the Labor Force in Moosup.
What is the Unemployment Rate in Moosup?
Unemployment Rate in Moosup is 6.8%.