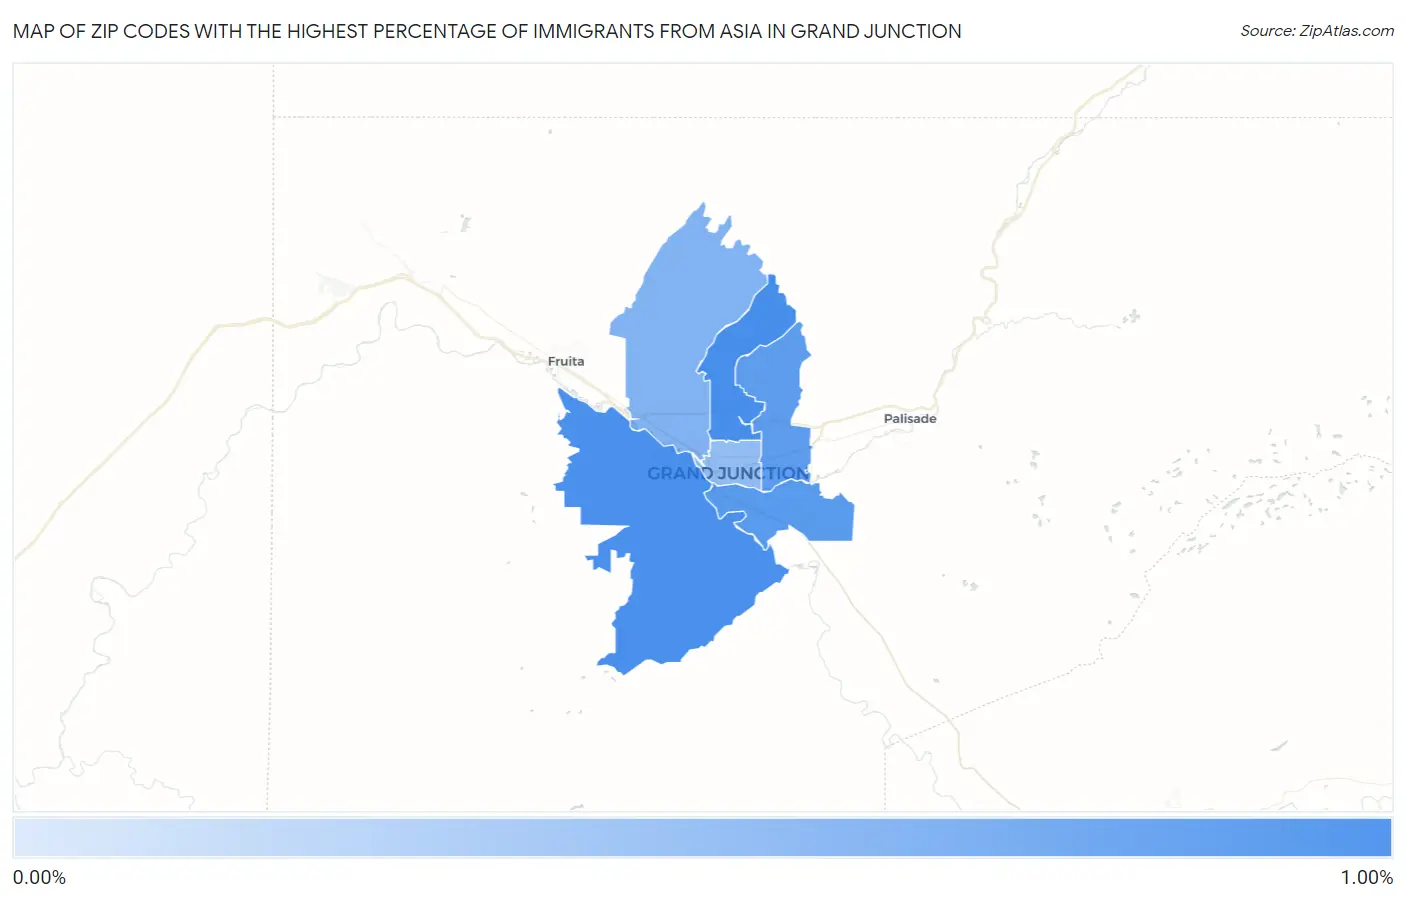
Zip Codes with the Highest Percentage of Immigrants from Asia in Grand Junction, CO
RELATED REPORTS & OPTIONS
Asia
Grand Junction
Compare Zip Codes
Map of Zip Codes with the Highest Percentage of Immigrants from Asia in Grand Junction
0.46%
0.93%
Zip Codes with the Highest Percentage of Immigrants from Asia in Grand Junction, CO
| Zip Code | Asia | vs State | vs National | |
| 1. | 81506 | 0.93% | 2.32%(-1.39)#167 | 4.26%(-3.33)#10,704 |
| 2. | 81507 | 0.92% | 2.32%(-1.41)#169 | 4.26%(-3.34)#10,812 |
| 3. | 81503 | 0.83% | 2.32%(-1.49)#182 | 4.26%(-3.43)#11,283 |
| 4. | 81504 | 0.78% | 2.32%(-1.54)#191 | 4.26%(-3.48)#11,625 |
| 5. | 81505 | 0.58% | 2.32%(-1.75)#205 | 4.26%(-3.68)#13,174 |
| 6. | 81501 | 0.46% | 2.32%(-1.86)#229 | 4.26%(-3.80)#14,175 |
1
Common Questions
What are the Top 5 Zip Codes with the Highest Percentage of Immigrants from Asia in Grand Junction, CO?
Top 5 Zip Codes with the Highest Percentage of Immigrants from Asia in Grand Junction, CO are:
What zip code has the Highest Percentage of Immigrants from Asia in Grand Junction, CO?
81506 has the Highest Percentage of Immigrants from Asia in Grand Junction, CO with 0.93%.
What is the Percentage of Immigrants from Asia in Grand Junction, CO?
Percentage of Immigrants from Asia in Grand Junction is 0.78%.
What is the Percentage of Immigrants from Asia in Colorado?
Percentage of Immigrants from Asia in Colorado is 2.32%.
What is the Percentage of Immigrants from Asia in the United States?
Percentage of Immigrants from Asia in the United States is 4.26%.