Zip Codes with the Highest Percentage of Population Employed in Farming, Fishing & Forestry in Grand Junction, CO
RELATED REPORTS & OPTIONS
Farming, Fishing & Forestry
Grand Junction
Compare Zip Codes
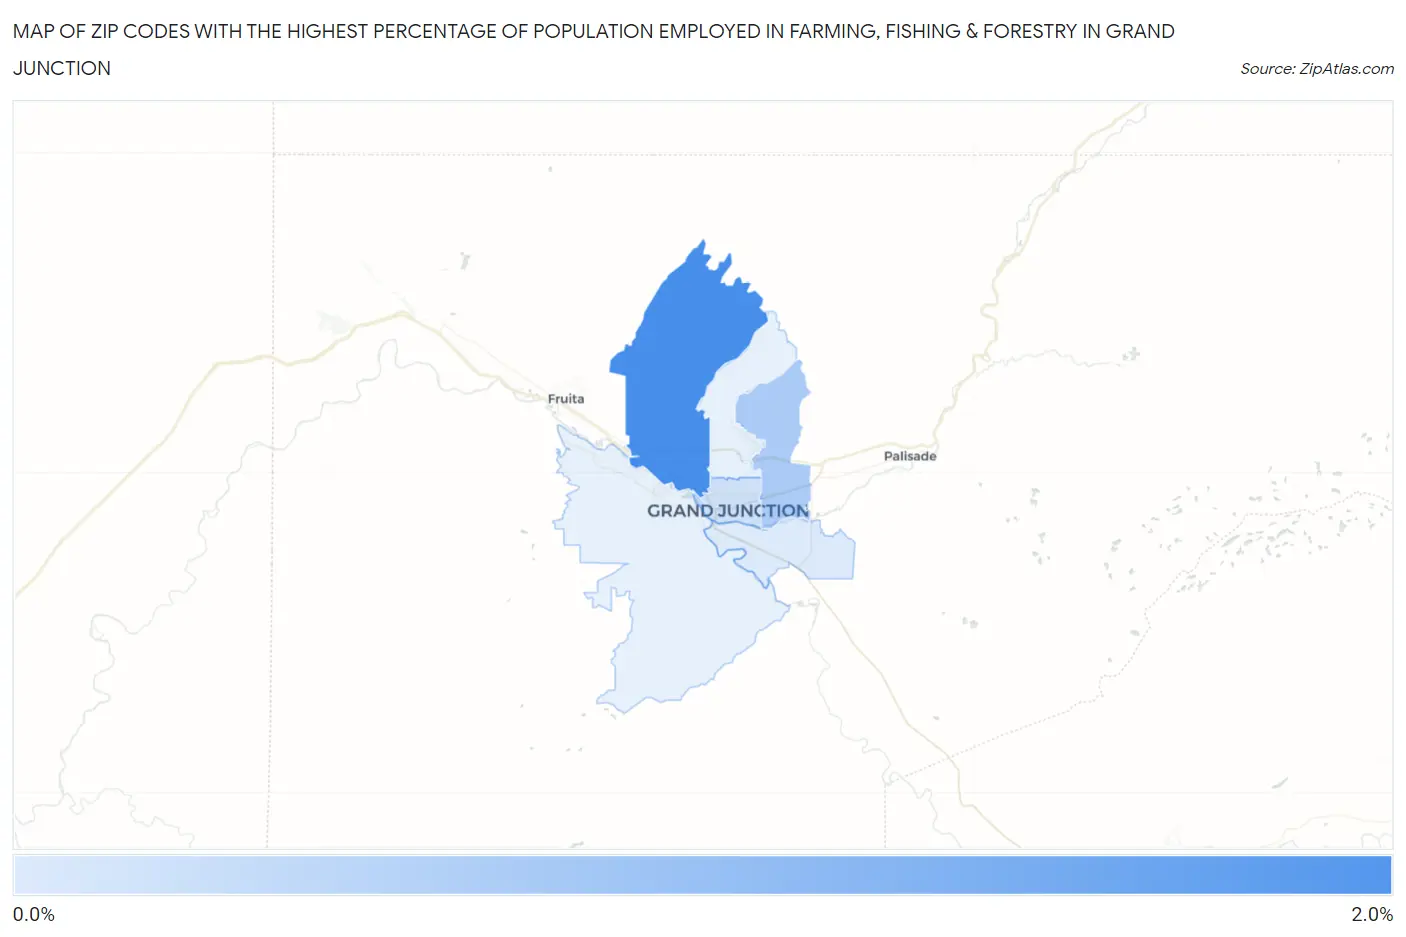
Map of Zip Codes with the Highest Percentage of Population Employed in Farming, Fishing & Forestry in Grand Junction
0.31%
1.8%
Zip Codes with the Highest Percentage of Population Employed in Farming, Fishing & Forestry in Grand Junction, CO
| Zip Code | % Employed | vs State | vs National | |
| 1. | 81505 | 1.8% | 0.49%(+1.35)#123 | 0.61%(+1.23)#6,924 |
| 2. | 81504 | 0.83% | 0.49%(+0.344)#167 | 0.61%(+0.226)#10,602 |
| 3. | 81501 | 0.44% | 0.49%(-0.046)#215 | 0.61%(-0.164)#13,372 |
| 4. | 81503 | 0.31% | 0.49%(-0.180)#241 | 0.61%(-0.299)#14,747 |
1
Common Questions
What are the Top 5 Zip Codes with the Highest Percentage of Population Employed in Farming, Fishing & Forestry in Grand Junction, CO?
Top 5 Zip Codes with the Highest Percentage of Population Employed in Farming, Fishing & Forestry in Grand Junction, CO are:
What zip code has the Highest Percentage of Population Employed in Farming, Fishing & Forestry in Grand Junction, CO?
81505 has the Highest Percentage of Population Employed in Farming, Fishing & Forestry in Grand Junction, CO with 1.8%.
What is the Percentage of Population Employed in Farming, Fishing & Forestry in Grand Junction, CO?
Percentage of Population Employed in Farming, Fishing & Forestry in Grand Junction is 0.57%.
What is the Percentage of Population Employed in Farming, Fishing & Forestry in Colorado?
Percentage of Population Employed in Farming, Fishing & Forestry in Colorado is 0.49%.
What is the Percentage of Population Employed in Farming, Fishing & Forestry in the United States?
Percentage of Population Employed in Farming, Fishing & Forestry in the United States is 0.61%.