Zip Codes with the Highest Percentage of Population Employed in Mining, Quarrying, & Extraction in Grand Junction, CO
RELATED REPORTS & OPTIONS
Mining, Quarrying, & Extraction
Grand Junction
Compare Zip Codes
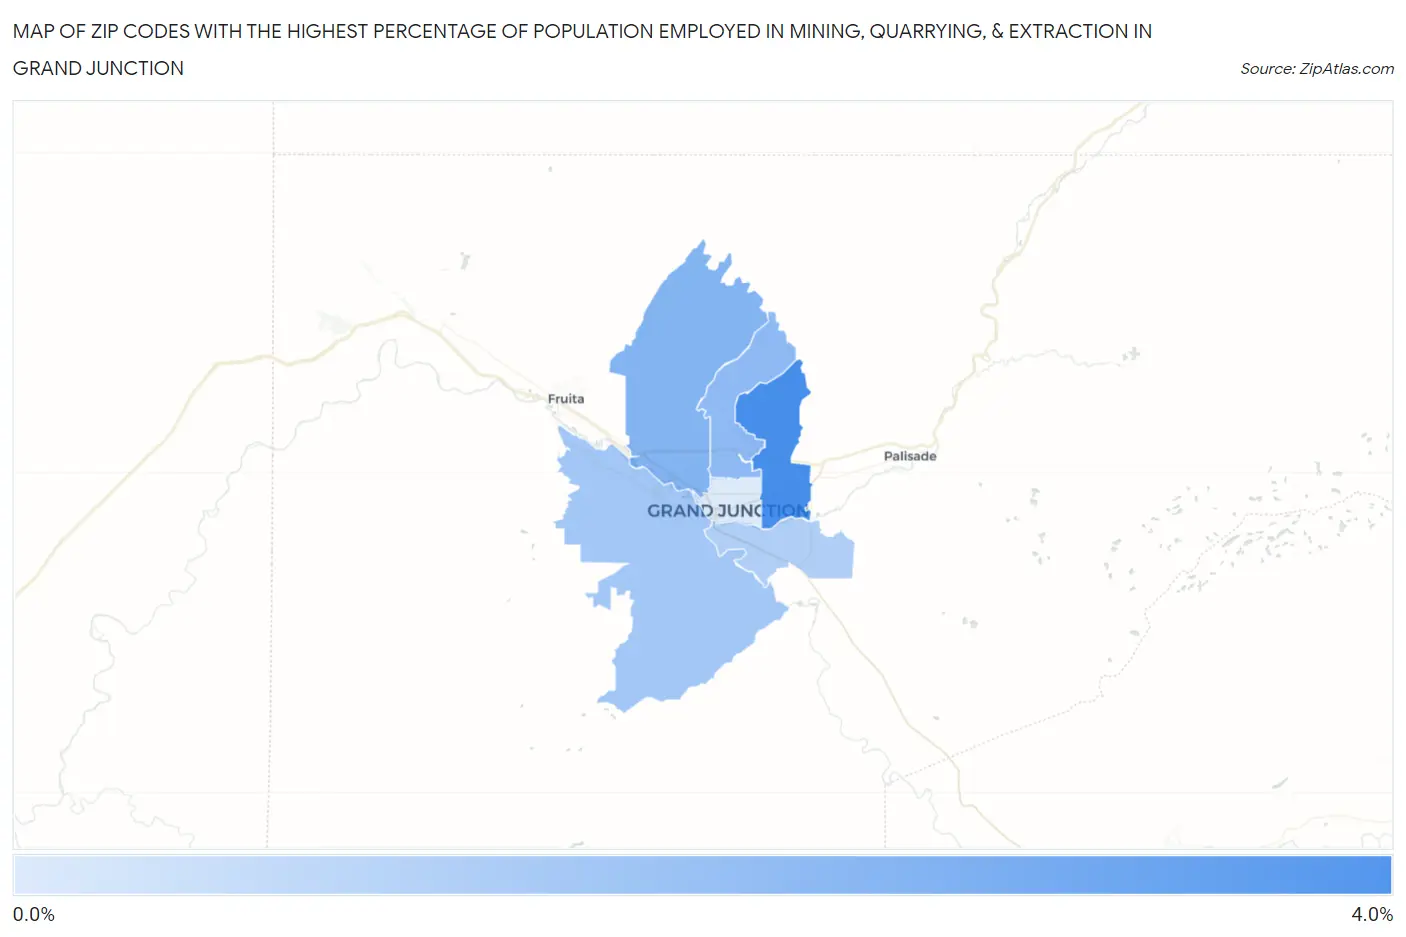
Map of Zip Codes with the Highest Percentage of Population Employed in Mining, Quarrying, & Extraction in Grand Junction
0.79%
3.2%
Zip Codes with the Highest Percentage of Population Employed in Mining, Quarrying, & Extraction in Grand Junction, CO
| Zip Code | % Employed | vs State | vs National | |
| 1. | 81504 | 3.2% | 0.87%(+2.36)#52 | 0.44%(+2.79)#2,587 |
| 2. | 81505 | 2.2% | 0.87%(+1.37)#77 | 0.44%(+1.80)#3,400 |
| 3. | 81506 | 2.1% | 0.87%(+1.19)#88 | 0.44%(+1.62)#3,596 |
| 4. | 81507 | 1.7% | 0.87%(+0.834)#99 | 0.44%(+1.26)#4,020 |
| 5. | 81503 | 1.5% | 0.87%(+0.609)#113 | 0.44%(+1.04)#4,403 |
| 6. | 81501 | 0.79% | 0.87%(-0.081)#179 | 0.44%(+0.347)#6,024 |
1
Common Questions
What are the Top 5 Zip Codes with the Highest Percentage of Population Employed in Mining, Quarrying, & Extraction in Grand Junction, CO?
Top 5 Zip Codes with the Highest Percentage of Population Employed in Mining, Quarrying, & Extraction in Grand Junction, CO are:
What zip code has the Highest Percentage of Population Employed in Mining, Quarrying, & Extraction in Grand Junction, CO?
81504 has the Highest Percentage of Population Employed in Mining, Quarrying, & Extraction in Grand Junction, CO with 3.2%.
What is the Percentage of Population Employed in Mining, Quarrying, & Extraction in Grand Junction, CO?
Percentage of Population Employed in Mining, Quarrying, & Extraction in Grand Junction is 2.2%.
What is the Percentage of Population Employed in Mining, Quarrying, & Extraction in Colorado?
Percentage of Population Employed in Mining, Quarrying, & Extraction in Colorado is 0.87%.
What is the Percentage of Population Employed in Mining, Quarrying, & Extraction in the United States?
Percentage of Population Employed in Mining, Quarrying, & Extraction in the United States is 0.44%.