Zip Codes with the Highest Percentage of Population Employed in Legal Services & Support in Grand Junction, CO
RELATED REPORTS & OPTIONS
Legal Services & Support
Grand Junction
Compare Zip Codes
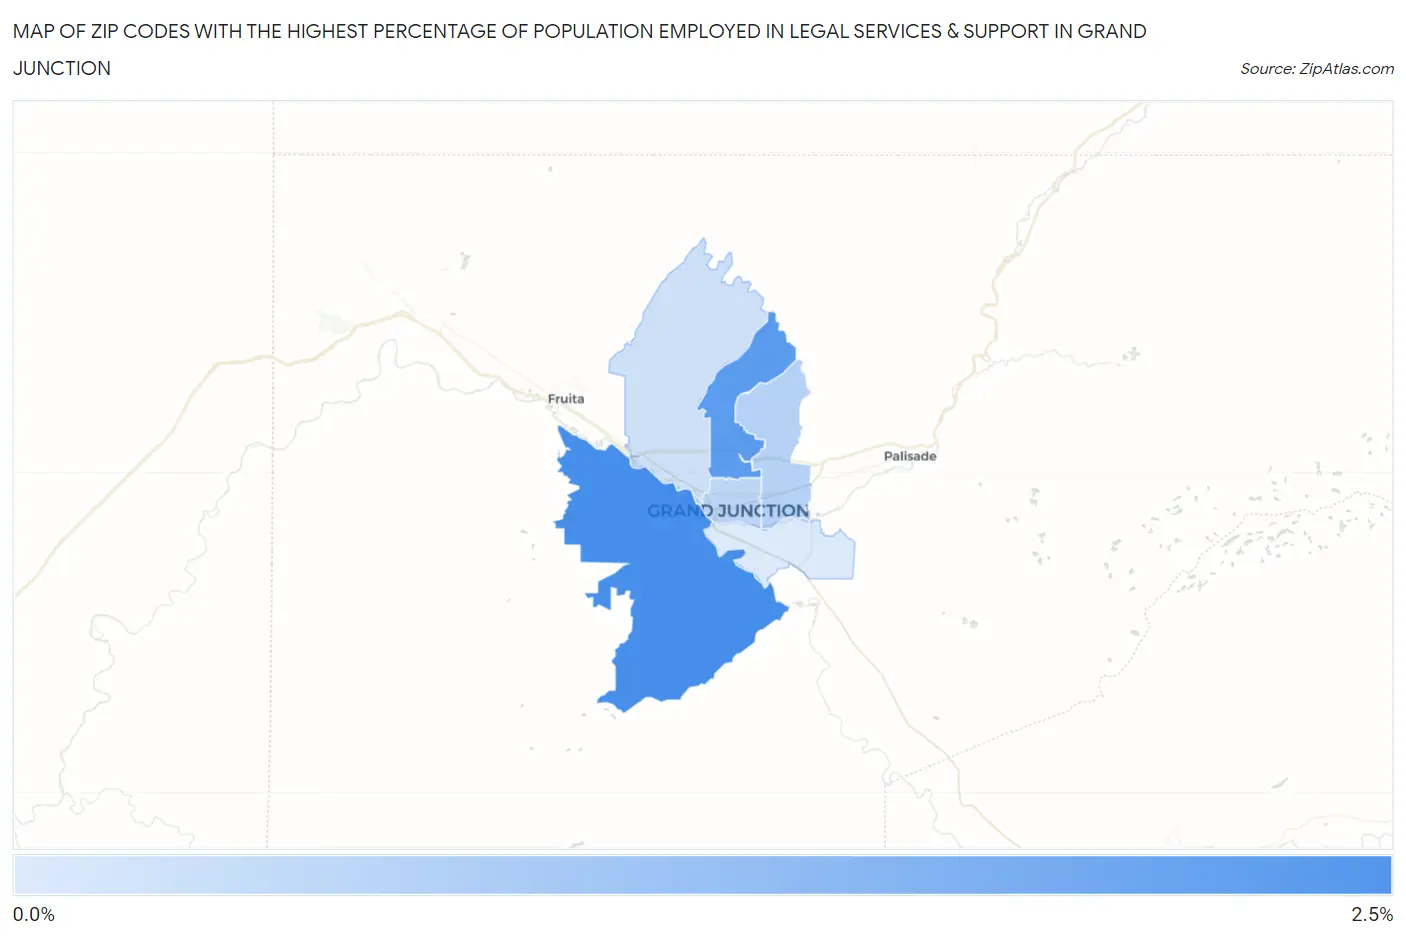
Map of Zip Codes with the Highest Percentage of Population Employed in Legal Services & Support in Grand Junction
0.22%
2.2%
Zip Codes with the Highest Percentage of Population Employed in Legal Services & Support in Grand Junction, CO
| Zip Code | % Employed | vs State | vs National | |
| 1. | 81507 | 2.2% | 1.2%(+0.989)#59 | 1.2%(+0.989)#3,087 |
| 2. | 81506 | 1.9% | 1.2%(+0.737)#71 | 1.2%(+0.738)#3,669 |
| 3. | 81504 | 0.72% | 1.2%(-0.469)#198 | 1.2%(-0.468)#10,257 |
| 4. | 81501 | 0.65% | 1.2%(-0.535)#212 | 1.2%(-0.535)#10,956 |
| 5. | 81505 | 0.42% | 1.2%(-0.768)#242 | 1.2%(-0.768)#13,657 |
| 6. | 81503 | 0.22% | 1.2%(-0.961)#277 | 1.2%(-0.961)#15,959 |
1
Common Questions
What are the Top 5 Zip Codes with the Highest Percentage of Population Employed in Legal Services & Support in Grand Junction, CO?
Top 5 Zip Codes with the Highest Percentage of Population Employed in Legal Services & Support in Grand Junction, CO are:
What zip code has the Highest Percentage of Population Employed in Legal Services & Support in Grand Junction, CO?
81507 has the Highest Percentage of Population Employed in Legal Services & Support in Grand Junction, CO with 2.2%.
What is the Percentage of Population Employed in Legal Services & Support in Grand Junction, CO?
Percentage of Population Employed in Legal Services & Support in Grand Junction is 0.88%.
What is the Percentage of Population Employed in Legal Services & Support in Colorado?
Percentage of Population Employed in Legal Services & Support in Colorado is 1.2%.
What is the Percentage of Population Employed in Legal Services & Support in the United States?
Percentage of Population Employed in Legal Services & Support in the United States is 1.2%.