Zip Codes with the Highest Percentage of Population Employed in Professional & Scientific Services in San Jose, CA
RELATED REPORTS & OPTIONS
Professional & Scientific Services
San Jose
Compare Zip Codes
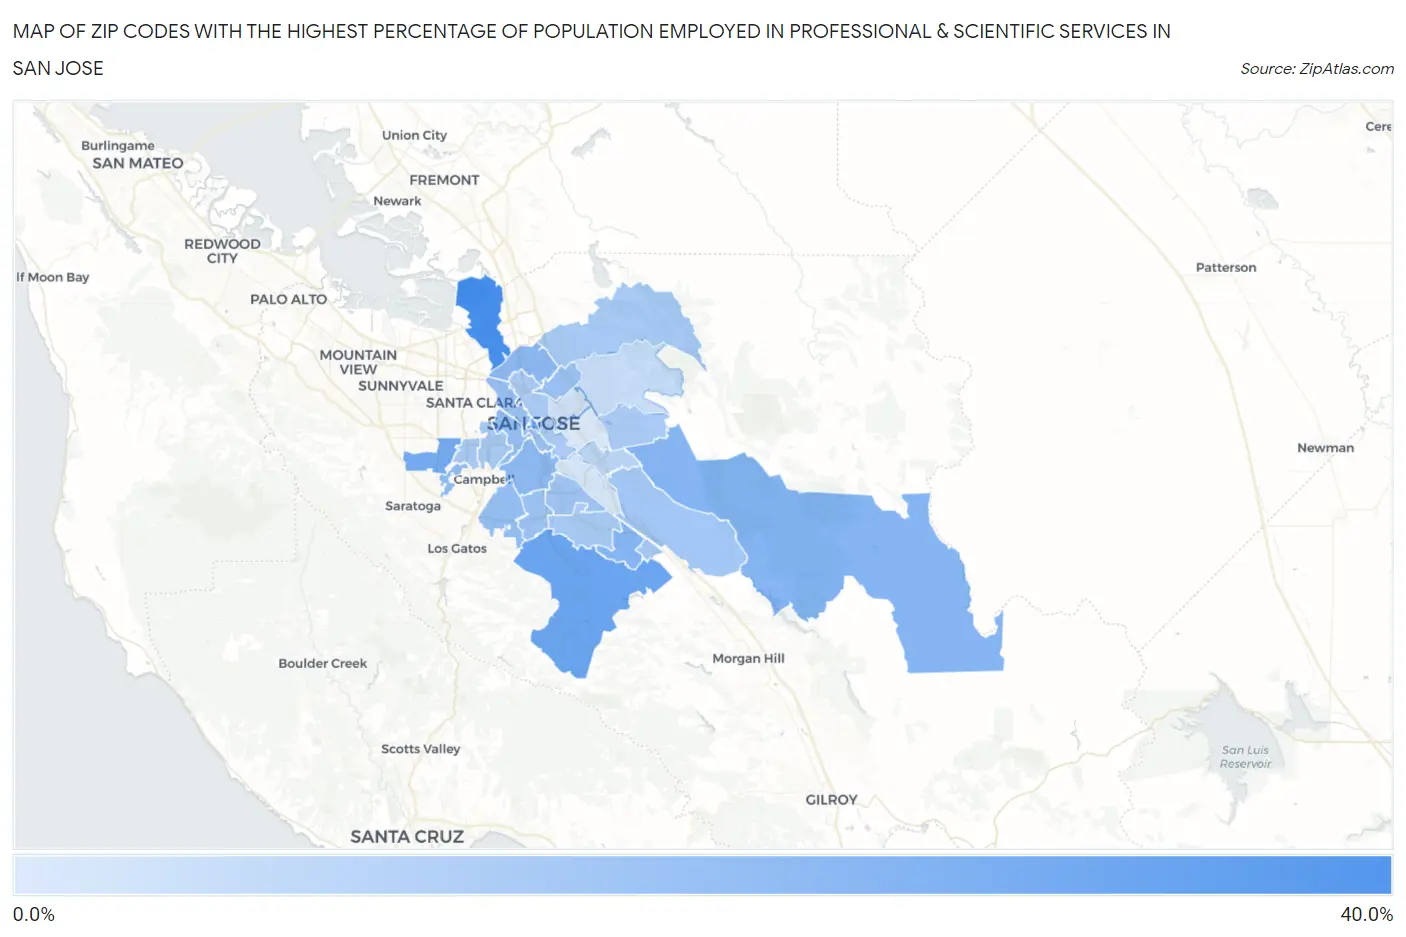
Map of Zip Codes with the Highest Percentage of Population Employed in Professional & Scientific Services in San Jose
0.0%
40.0%
Zip Codes with the Highest Percentage of Population Employed in Professional & Scientific Services in San Jose, CA
| Zip Code | % Employed | vs State | vs National | |
| 1. | 95134 | 31.1% | 9.4%(+21.7)#15 | 7.8%(+23.2)#198 |
| 2. | 95113 | 24.6% | 9.4%(+15.2)#68 | 7.8%(+16.8)#455 |
| 3. | 95120 | 24.3% | 9.4%(+14.8)#77 | 7.8%(+16.4)#484 |
| 4. | 95129 | 22.6% | 9.4%(+13.1)#103 | 7.8%(+14.7)#617 |
| 5. | 95135 | 19.7% | 9.4%(+10.3)#152 | 7.8%(+11.9)#918 |
| 6. | 95119 | 19.5% | 9.4%(+10.1)#156 | 7.8%(+11.7)#945 |
| 7. | 95131 | 18.4% | 9.4%(+9.01)#185 | 7.8%(+10.6)#1,083 |
| 8. | 95125 | 17.9% | 9.4%(+8.45)#203 | 7.8%(+10.0)#1,179 |
| 9. | 95130 | 17.7% | 9.4%(+8.27)#209 | 7.8%(+9.85)#1,206 |
| 10. | 95126 | 16.9% | 9.4%(+7.49)#236 | 7.8%(+9.07)#1,381 |
| 11. | 95124 | 16.7% | 9.4%(+7.22)#247 | 7.8%(+8.80)#1,449 |
| 12. | 95110 | 15.7% | 9.4%(+6.22)#272 | 7.8%(+7.81)#1,705 |
| 13. | 95133 | 15.5% | 9.4%(+6.09)#278 | 7.8%(+7.68)#1,741 |
| 14. | 95118 | 15.0% | 9.4%(+5.61)#294 | 7.8%(+7.20)#1,882 |
| 15. | 95136 | 14.7% | 9.4%(+5.25)#305 | 7.8%(+6.84)#2,015 |
| 16. | 95138 | 14.4% | 9.4%(+4.99)#319 | 7.8%(+6.58)#2,116 |
| 17. | 95139 | 14.0% | 9.4%(+4.60)#327 | 7.8%(+6.19)#2,259 |
| 18. | 95123 | 13.7% | 9.4%(+4.31)#338 | 7.8%(+5.90)#2,375 |
| 19. | 95132 | 13.6% | 9.4%(+4.21)#343 | 7.8%(+5.80)#2,416 |
| 20. | 95128 | 13.5% | 9.4%(+4.07)#348 | 7.8%(+5.66)#2,481 |
| 21. | 95148 | 13.4% | 9.4%(+3.94)#353 | 7.8%(+5.53)#2,548 |
| 22. | 95112 | 13.2% | 9.4%(+3.73)#363 | 7.8%(+5.32)#2,638 |
| 23. | 95117 | 13.1% | 9.4%(+3.69)#365 | 7.8%(+5.28)#2,660 |
| 24. | 95121 | 10.1% | 9.4%(+0.680)#534 | 7.8%(+2.27)#4,493 |
| 25. | 95127 | 8.4% | 9.4%(-1.06)#656 | 7.8%(+0.524)#6,178 |
| 26. | 95116 | 6.9% | 9.4%(-2.55)#802 | 7.8%(-0.964)#8,359 |
| 27. | 95111 | 5.9% | 9.4%(-3.54)#909 | 7.8%(-1.95)#10,181 |
| 28. | 95122 | 5.1% | 9.4%(-4.31)#1,010 | 7.8%(-2.72)#12,014 |
1
Common Questions
What are the Top 10 Zip Codes with the Highest Percentage of Population Employed in Professional & Scientific Services in San Jose, CA?
Top 10 Zip Codes with the Highest Percentage of Population Employed in Professional & Scientific Services in San Jose, CA are:
What zip code has the Highest Percentage of Population Employed in Professional & Scientific Services in San Jose, CA?
95134 has the Highest Percentage of Population Employed in Professional & Scientific Services in San Jose, CA with 31.1%.
What is the Percentage of Population Employed in Professional & Scientific Services in San Jose, CA?
Percentage of Population Employed in Professional & Scientific Services in San Jose is 14.7%.
What is the Percentage of Population Employed in Professional & Scientific Services in California?
Percentage of Population Employed in Professional & Scientific Services in California is 9.4%.
What is the Percentage of Population Employed in Professional & Scientific Services in the United States?
Percentage of Population Employed in Professional & Scientific Services in the United States is 7.8%.