Zip Codes with the Highest Percentage of Population Employed in Professional & Scientific Services in Citrus Heights, CA
RELATED REPORTS & OPTIONS
Professional & Scientific Services
Citrus Heights
Compare Zip Codes
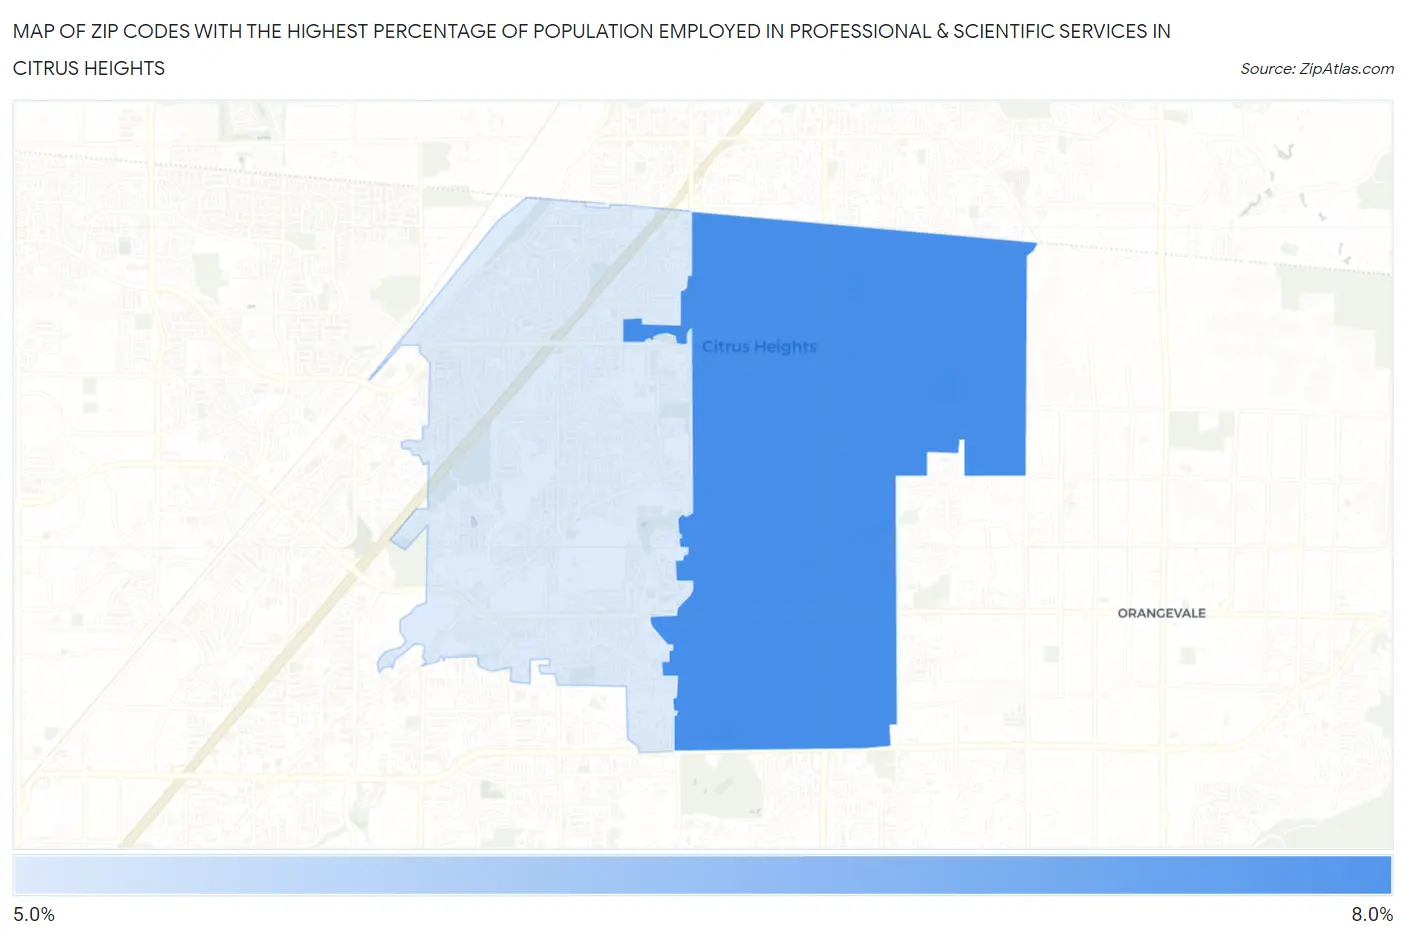
Map of Zip Codes with the Highest Percentage of Population Employed in Professional & Scientific Services in Citrus Heights
5.5%
6.9%
Zip Codes with the Highest Percentage of Population Employed in Professional & Scientific Services in Citrus Heights, CA
| Zip Code | % Employed | vs State | vs National | |
| 1. | 95610 | 6.9% | 9.4%(-2.55)#803 | 7.8%(-0.967)#8,365 |
| 2. | 95621 | 5.5% | 9.4%(-3.94)#962 | 7.8%(-2.36)#11,111 |
1
Common Questions
What are the Top Zip Codes with the Highest Percentage of Population Employed in Professional & Scientific Services in Citrus Heights, CA?
Top Zip Codes with the Highest Percentage of Population Employed in Professional & Scientific Services in Citrus Heights, CA are:
What zip code has the Highest Percentage of Population Employed in Professional & Scientific Services in Citrus Heights, CA?
95610 has the Highest Percentage of Population Employed in Professional & Scientific Services in Citrus Heights, CA with 6.9%.
What is the Percentage of Population Employed in Professional & Scientific Services in Citrus Heights, CA?
Percentage of Population Employed in Professional & Scientific Services in Citrus Heights is 6.1%.
What is the Percentage of Population Employed in Professional & Scientific Services in California?
Percentage of Population Employed in Professional & Scientific Services in California is 9.4%.
What is the Percentage of Population Employed in Professional & Scientific Services in the United States?
Percentage of Population Employed in Professional & Scientific Services in the United States is 7.8%.