Zip Codes with the Highest Percentage of Population Employed in Arts, Media & Entertainment in Stockton, CA

RELATED REPORTS & OPTIONS

Arts, Media & Entertainment
Population
Families and Households
Female Fertility
Female Fertility (Unmarried)
Race (Community Size)
Race (Percentage)
Ancestry (Community Size)
AfghanAfricanAlbanianAmericanApacheArabArgentineanArmenianAssyrian / Chaldean / SyriacAustrianBangladeshiBasqueBelgianBhutaneseBlackfeetBolivianBrazilianBritishBurmeseCanadianCape VerdeanCentral AmericanCentral American IndianCherokeeCheyenneChickasawChileanChippewaChoctawColombianCreekCroatianCubanCzechCzechoslovakianDanishDutchEastern EuropeanEcuadorianEgyptianEnglishEthiopianEuropeanFilipinoFinnishFrenchFrench American IndianFrench CanadianGermanGerman RussianGhanaianGreekGuamanian / ChamorroGuatemalanHaitianHonduranHopiHungarianIcelanderIndian (Asian)IndonesianIranianIrishIroquoisIsraeliItalianJamaicanJapaneseKenyanKoreanLaotianLatvianLebaneseLiberianLithuanianMalaysianMexicanMexican American IndianNative HawaiianNavajoNepaleseNicaraguanNigerianNorthern EuropeanNorwegianPaiutePakistaniPalestinianPanamanianPeruvianPolishPortuguesePotawatomiPuerto RicanRomanianRussianSalvadoranSamoanScandinavianScotch-IrishScottishSerbianSiouxSlavicSloveneSouth AmericanSouth American IndianSpaniardSpanishSri LankanSubsaharan AfricanSwedishSwissSyrianThaiTonganTrinidadian and TobagonianUkrainianVenezuelanVietnameseWelshWest IndianYakamaYaquiYugoslavian
Ancestry (Percentage)
AfghanAfricanAlbanianAmericanApacheArabArgentineanArmenianAssyrian / Chaldean / SyriacAustrianBangladeshiBasqueBelgianBhutaneseBlackfeetBolivianBrazilianBritishBurmeseCanadianCape VerdeanCentral AmericanCentral American IndianCherokeeCheyenneChickasawChileanChippewaChoctawColombianCreekCroatianCubanCzechCzechoslovakianDanishDutchEastern EuropeanEcuadorianEgyptianEnglishEthiopianEuropeanFilipinoFinnishFrenchFrench American IndianFrench CanadianGermanGerman RussianGhanaianGreekGuamanian / ChamorroGuatemalanHaitianHonduranHopiHungarianIcelanderIndian (Asian)IndonesianIranianIrishIroquoisIsraeliItalianJamaicanJapaneseKenyanKoreanLaotianLatvianLebaneseLiberianLithuanianMalaysianMexicanMexican American IndianNative HawaiianNavajoNepaleseNicaraguanNigerianNorthern EuropeanNorwegianPaiutePakistaniPalestinianPanamanianPeruvianPolishPortuguesePotawatomiPuerto RicanRomanianRussianSalvadoranSamoanScandinavianScotch-IrishScottishSerbianSiouxSlavicSloveneSouth AmericanSouth American IndianSpaniardSpanishSri LankanSubsaharan AfricanSwedishSwissSyrianThaiTonganTrinidadian and TobagonianUkrainianVenezuelanVietnameseWelshWest IndianYakamaYaquiYugoslavian
Immigrant Origin (Total)
Immigrant Origin (Percentage)
Income
Income (Families)
Income (Households)
Poverty
Poverty (Families)
Unemployment
Employment Occupations
Employment Industries
Employer Class
Commute Time
Commute Means
School Enrollment
Education by Degree Field
Occupancy
Finances
Physical Characteristics
Stockton
States
California Cities
AlamedaAlhambraAnaheimAntiochApple ValleyArcadiaAuburnBakersfieldBerkeleyBeverly HillsBreaBuena ParkBurbankCamarilloCanoga ParkCanyon CountryCarlsbadCarsonCastro ValleyChicoChinoChula VistaCitrus HeightsClovisComptonConcordCoronaCosta MesaCovinaCulver CityDaly CityDanvilleDavisDesert Hot SpringsDowneyDuarteEl CajonEl MonteElk GroveEncinoEscondidoEurekaFairfieldFontanaFremontFresnoFullertonGarden GroveGardenaGlendaleGlendoraGrass ValleyHaywardHemetHesperiaHuntington BeachIndioInglewoodIrvineLa JollaLa MesaLa MiradaLa PuenteLake ElsinoreLakewoodLancasterLivermoreLodiLoma LindaLompocLong BeachLos AltosLos AngelesLos GatosMaderaMalibuMantecaMenifeeMercedMission ViejoModestoMonterey ParkMoragaMoreno ValleyMountain ViewMurrietaNapaNewport BeachNorth HollywoodNorthridgeNovatoOaklandOceansideOntarioOrangeOrovilleOxnardPalm DesertPalm SpringsPalmdalePalo AltoPasadenaPerrisPetalumaPleasantonPomonaRancho CordovaRancho CucamongaReddingRedlandsRedondo BeachRedwood CityRialtoRichmondRiversideRocklinRosevilleSacramentoSalinasSan BernardinoSan ClementeSan DiegoSan FranciscoSan GabrielSan JacintoSan JoseSan LeandroSan Luis ObispoSan MarcosSan MateoSan PedroSan RafaelSan RamonSanta AnaSanta BarbaraSanta ClaraSanta ClaritaSanta CruzSanta MariaSanta MonicaSanta RosaSherman OaksSimi ValleySpring ValleyStocktonSunnyvaleTemeculaThousand OaksTorranceTracyTurlockTustinUplandVacavilleValenciaVallejoVan NuysVenturaVictorvilleVisaliaVistaWalnut CreekWest CovinaWest SacramentoWhittierWoodlandWoodland HillsYorba LindaYuba City
Compare Zip Codes
Comparison Subject

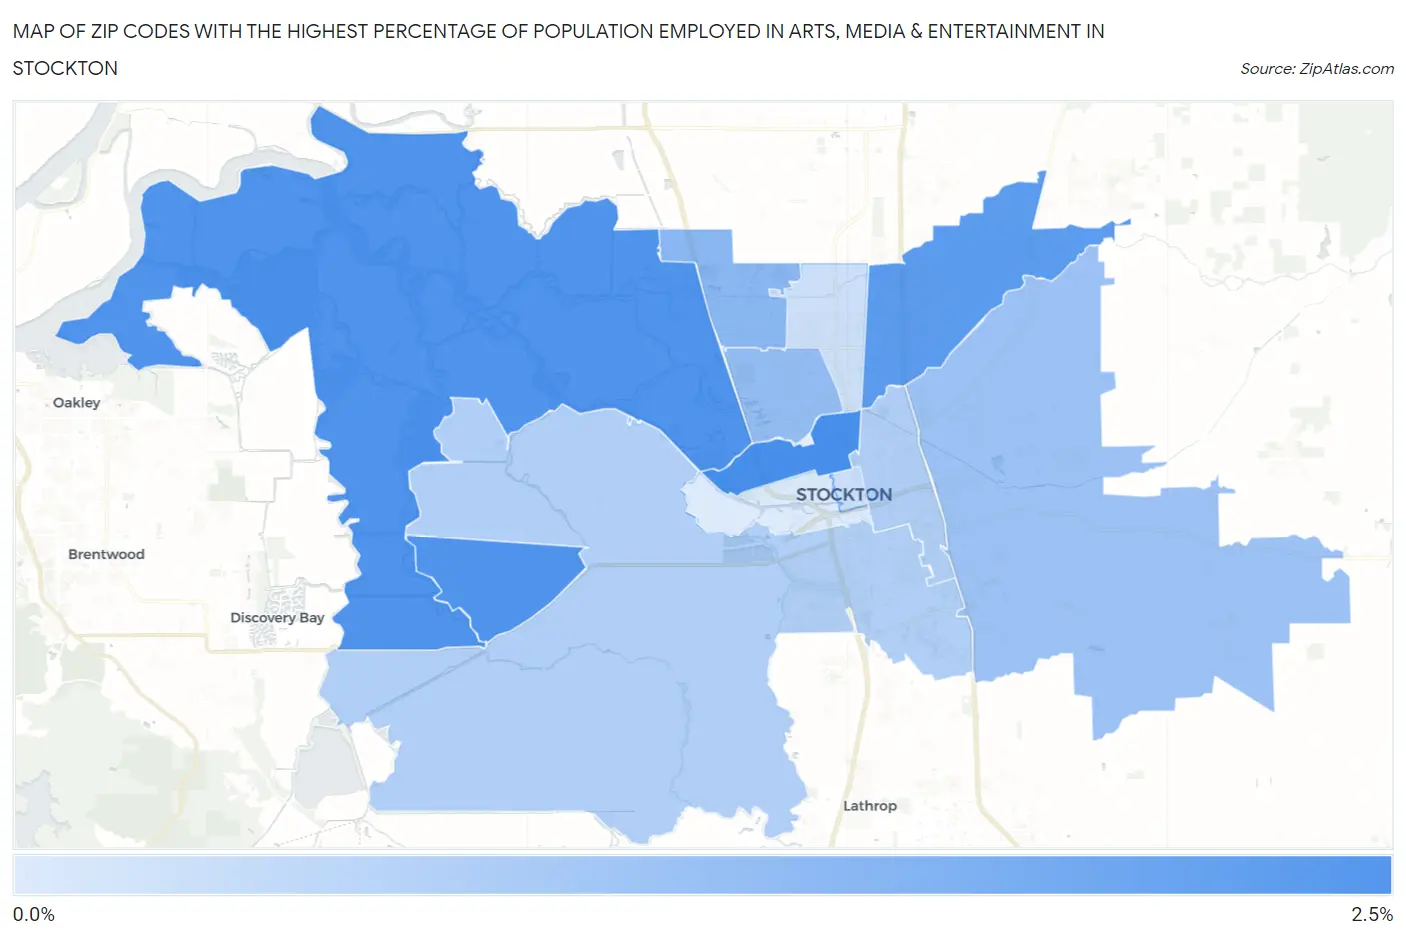
Map of Zip Codes with the Highest Percentage of Population Employed in Arts, Media & Entertainment in Stockton

0.0%
2.5%
Zip Codes with the Highest Percentage of Population Employed in Arts, Media & Entertainment in Stockton Map

Zip Codes with the Highest Percentage of Population Employed in Arts, Media & Entertainment in Stockton, CA

Zip Code % Employed vs State vs National
1.952042.2%3.0%(-0.769)#6862.1%(+0.135)#6,841
2.952192.1%3.0%(-0.874)#7312.1%(+0.030)#7,325
3.952121.9%3.0%(-1.05)#7922.1%(-0.143)#8,278
4.952091.3%3.0%(-1.67)#1,0332.1%(-0.761)#12,459
5.952071.2%3.0%(-1.78)#1,0762.1%(-0.873)#13,318
6.952151.1%3.0%(-1.91)#1,1172.1%(-1.00)#14,327
7.952050.83%3.0%(-2.13)#1,2022.1%(-1.23)#16,146
8.952060.78%3.0%(-2.19)#1,2262.1%(-1.29)#16,622
9.952020.46%3.0%(-2.51)#1,2962.1%(-1.60)#19,252
10.952100.43%3.0%(-2.53)#1,3012.1%(-1.63)#19,386
11.952030.22%3.0%(-2.75)#1,3352.1%(-1.85)#20,873

Common Questions

What are the Top 10 Zip Codes with the Highest Percentage of Population Employed in Arts, Media & Entertainment in Stockton, CA?
Top 10 Zip Codes with the Highest Percentage of Population Employed in Arts, Media & Entertainment in Stockton, CA are:
#1
2.2%
#2
2.1%
#3
1.9%
#4
1.3%
#5
1.2%
#6
1.1%
#7
0.83%
#8
0.78%
#9
0.46%
#10
0.43%
What zip code has the Highest Percentage of Population Employed in Arts, Media & Entertainment in Stockton, CA?
95204 has the Highest Percentage of Population Employed in Arts, Media & Entertainment in Stockton, CA with 2.2%.
What is the Percentage of Population Employed in Arts, Media & Entertainment in Stockton, CA?
Percentage of Population Employed in Arts, Media & Entertainment in Stockton is 1.2%.
What is the Percentage of Population Employed in Arts, Media & Entertainment in California?
Percentage of Population Employed in Arts, Media & Entertainment in California is 3.0%.
What is the Percentage of Population Employed in Arts, Media & Entertainment in the United States?
Percentage of Population Employed in Arts, Media & Entertainment in the United States is 2.1%.