Zip Codes with the Highest Percentage of Population Employed in Arts, Media & Entertainment in San Clemente, CA
RELATED REPORTS & OPTIONS
Arts, Media & Entertainment
San Clemente
Compare Zip Codes
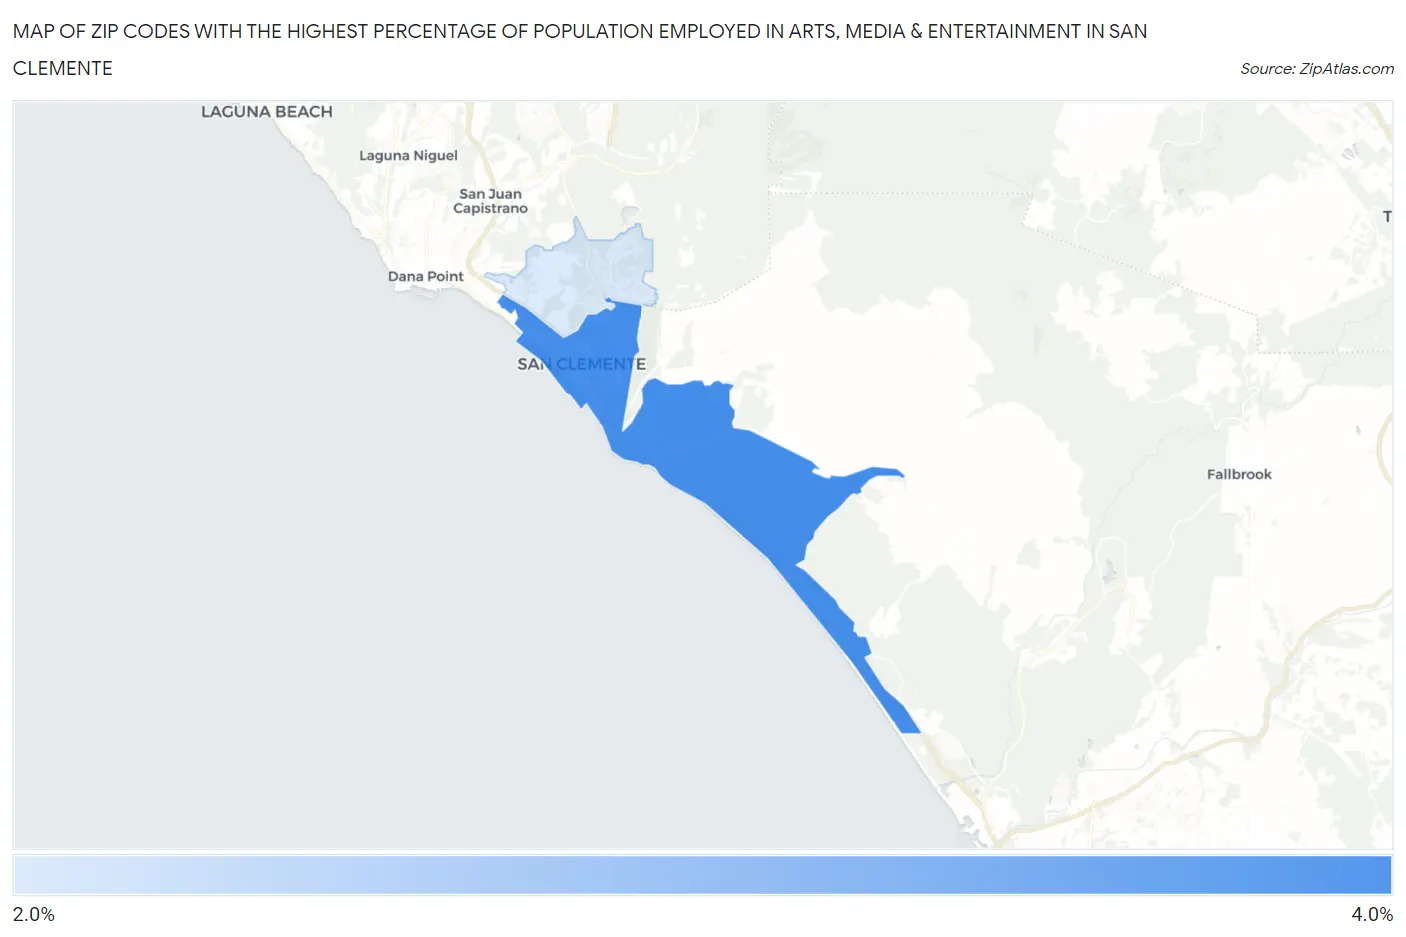
Map of Zip Codes with the Highest Percentage of Population Employed in Arts, Media & Entertainment in San Clemente
2.1%
3.6%
Zip Codes with the Highest Percentage of Population Employed in Arts, Media & Entertainment in San Clemente, CA
| Zip Code | % Employed | vs State | vs National | |
| 1. | 92672 | 3.6% | 3.0%(+0.628)#381 | 2.1%(+1.53)#2,917 |
| 2. | 92673 | 2.1% | 3.0%(-0.870)#726 | 2.1%(+0.035)#7,299 |
1
Common Questions
What are the Top Zip Codes with the Highest Percentage of Population Employed in Arts, Media & Entertainment in San Clemente, CA?
Top Zip Codes with the Highest Percentage of Population Employed in Arts, Media & Entertainment in San Clemente, CA are:
What zip code has the Highest Percentage of Population Employed in Arts, Media & Entertainment in San Clemente, CA?
92672 has the Highest Percentage of Population Employed in Arts, Media & Entertainment in San Clemente, CA with 3.6%.
What is the Percentage of Population Employed in Arts, Media & Entertainment in San Clemente, CA?
Percentage of Population Employed in Arts, Media & Entertainment in San Clemente is 2.9%.
What is the Percentage of Population Employed in Arts, Media & Entertainment in California?
Percentage of Population Employed in Arts, Media & Entertainment in California is 3.0%.
What is the Percentage of Population Employed in Arts, Media & Entertainment in the United States?
Percentage of Population Employed in Arts, Media & Entertainment in the United States is 2.1%.