Zip Codes with the Highest Percentage of Population Employed in Community & Social Service in Huntsville, AL

RELATED REPORTS & OPTIONS

Community & Social Service
Population
Families and Households
Female Fertility
Female Fertility (Unmarried)
Race (Community Size)
Race (Percentage)
Ancestry (Community Size)
AfricanAmericanArabArgentineanArmenianAustrianBahamianBarbadianBelgianBermudanBhutaneseBlackfeetBrazilianBritishBritish West IndianBurmeseCanadianCentral AmericanCentral American IndianCherokeeChileanChippewaChoctawColombianCreekCroatianCubanCzechCzechoslovakianDanishDominicanDutchEastern EuropeanEcuadorianEgyptianEnglishEuropeanFilipinoFinnishFrenchFrench CanadianGermanGreekGuamanian / ChamorroGuatemalanHaitianHonduranHungarianIndian (Asian)IranianIrishIroquoisItalianJamaicanJapaneseKenyanKoreanLatvianLebaneseLithuanianLuxembourgerMalaysianMexicanMexican American IndianNative HawaiianNigerianNorthern EuropeanNorwegianPakistaniPanamanianPennsylvania GermanPeruvianPolishPortuguesePuerto RicanRomanianRussianSalvadoranSamoanScandinavianScotch-IrishScottishSlavicSlovakSloveneSouth AmericanSpaniardSpanishSri LankanSubsaharan AfricanSwedishSwissSyrianThaiTrinidadian and TobagonianTurkishU.S. Virgin IslanderUkrainianVenezuelanWelshWest IndianYugoslavianYup'ik
Ancestry (Percentage)
AfricanAmericanArabArgentineanArmenianAustrianBahamianBarbadianBelgianBermudanBhutaneseBlackfeetBrazilianBritishBritish West IndianBurmeseCanadianCentral AmericanCentral American IndianCherokeeChileanChippewaChoctawColombianCreekCroatianCubanCzechCzechoslovakianDanishDominicanDutchEastern EuropeanEcuadorianEgyptianEnglishEuropeanFilipinoFinnishFrenchFrench CanadianGermanGreekGuamanian / ChamorroGuatemalanHaitianHonduranHungarianIndian (Asian)IranianIrishIroquoisItalianJamaicanJapaneseKenyanKoreanLatvianLebaneseLithuanianLuxembourgerMalaysianMexicanMexican American IndianNative HawaiianNigerianNorthern EuropeanNorwegianPakistaniPanamanianPennsylvania GermanPeruvianPolishPortuguesePuerto RicanRomanianRussianSalvadoranSamoanScandinavianScotch-IrishScottishSlavicSlovakSloveneSouth AmericanSpaniardSpanishSri LankanSubsaharan AfricanSwedishSwissSyrianThaiTrinidadian and TobagonianTurkishU.S. Virgin IslanderUkrainianVenezuelanWelshWest IndianYugoslavianYup'ik
Immigrant Origin (Total)
Immigrant Origin (Percentage)
Income
Income (Families)
Income (Households)
Poverty
Poverty (Families)
Unemployment
Employment Occupations
Employment Industries
Employer Class
Commute Time
Commute Means
School Enrollment
Education by Degree Field
Occupancy
Finances
Physical Characteristics
Huntsville
Compare Zip Codes
Comparison Subject

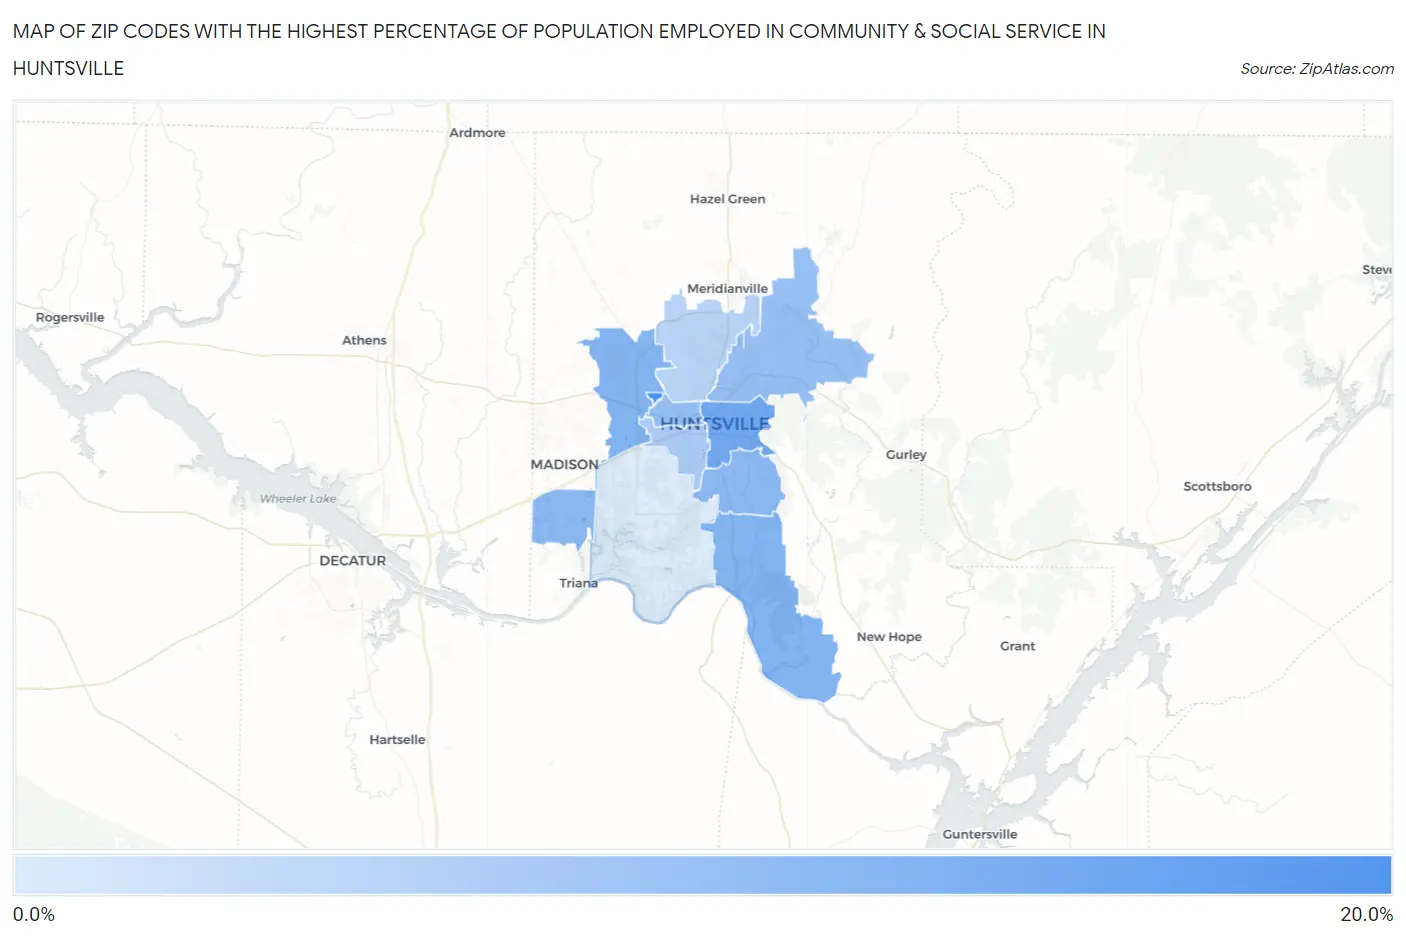
Map of Zip Codes with the Highest Percentage of Population Employed in Community & Social Service in Huntsville

0.0%
20.0%
Zip Codes with the Highest Percentage of Population Employed in Community & Social Service  in Huntsville Map

Zip Codes with the Highest Percentage of Population Employed in Community & Social Service in Huntsville, AL

Zip Code % Employed vs State vs National
1.3589617.4%10.1%(+7.32)#3111.2%(+6.16)#3,140
2.3580113.5%10.1%(+3.43)#7611.2%(+2.27)#6,768
3.3580311.8%10.1%(+1.76)#12711.2%(+0.597)#9,740
4.3580611.8%10.1%(+1.73)#12811.2%(+0.572)#9,795
5.3582411.0%10.1%(+0.932)#16611.2%(-0.230)#11,682
6.3580211.0%10.1%(+0.904)#16711.2%(-0.258)#11,749
7.3581610.1%10.1%(+0.097)#20111.2%(-1.06)#13,741
8.3581110.0%10.1%(-0.074)#20511.2%(-1.24)#14,184
9.358058.2%10.1%(-1.81)#28511.2%(-2.97)#18,913
10.358107.1%10.1%(-2.98)#37811.2%(-4.15)#21,966
11.358083.9%10.1%(-6.14)#51311.2%(-7.30)#27,660

Common Questions

What are the Top 10 Zip Codes with the Highest Percentage of Population Employed in Community & Social Service in Huntsville, AL?
Top 10 Zip Codes with the Highest Percentage of Population Employed in Community & Social Service in Huntsville, AL are:
#1
17.4%
#2
13.5%
#3
11.8%
#4
11.8%
#5
11.0%
#6
11.0%
#7
10.1%
#8
10.0%
#9
8.2%
#10
7.1%
What zip code has the Highest Percentage of Population Employed in Community & Social Service in Huntsville, AL?
35896 has the Highest Percentage of Population Employed in Community & Social Service in Huntsville, AL with 17.4%.
What is the Percentage of Population Employed in Community & Social Service in Huntsville, AL?
Percentage of Population Employed in Community & Social Service in Huntsville is 10.5%.
What is the Percentage of Population Employed in Community & Social Service in Alabama?
Percentage of Population Employed in Community & Social Service in Alabama is 10.1%.
What is the Percentage of Population Employed in Community & Social Service in the United States?
Percentage of Population Employed in Community & Social Service in the United States is 11.2%.