Zip Codes with the Highest Percentage of Population Employed in Office & Administration in Cullman, AL
RELATED REPORTS & OPTIONS
Office & Administration
Cullman
Compare Zip Codes
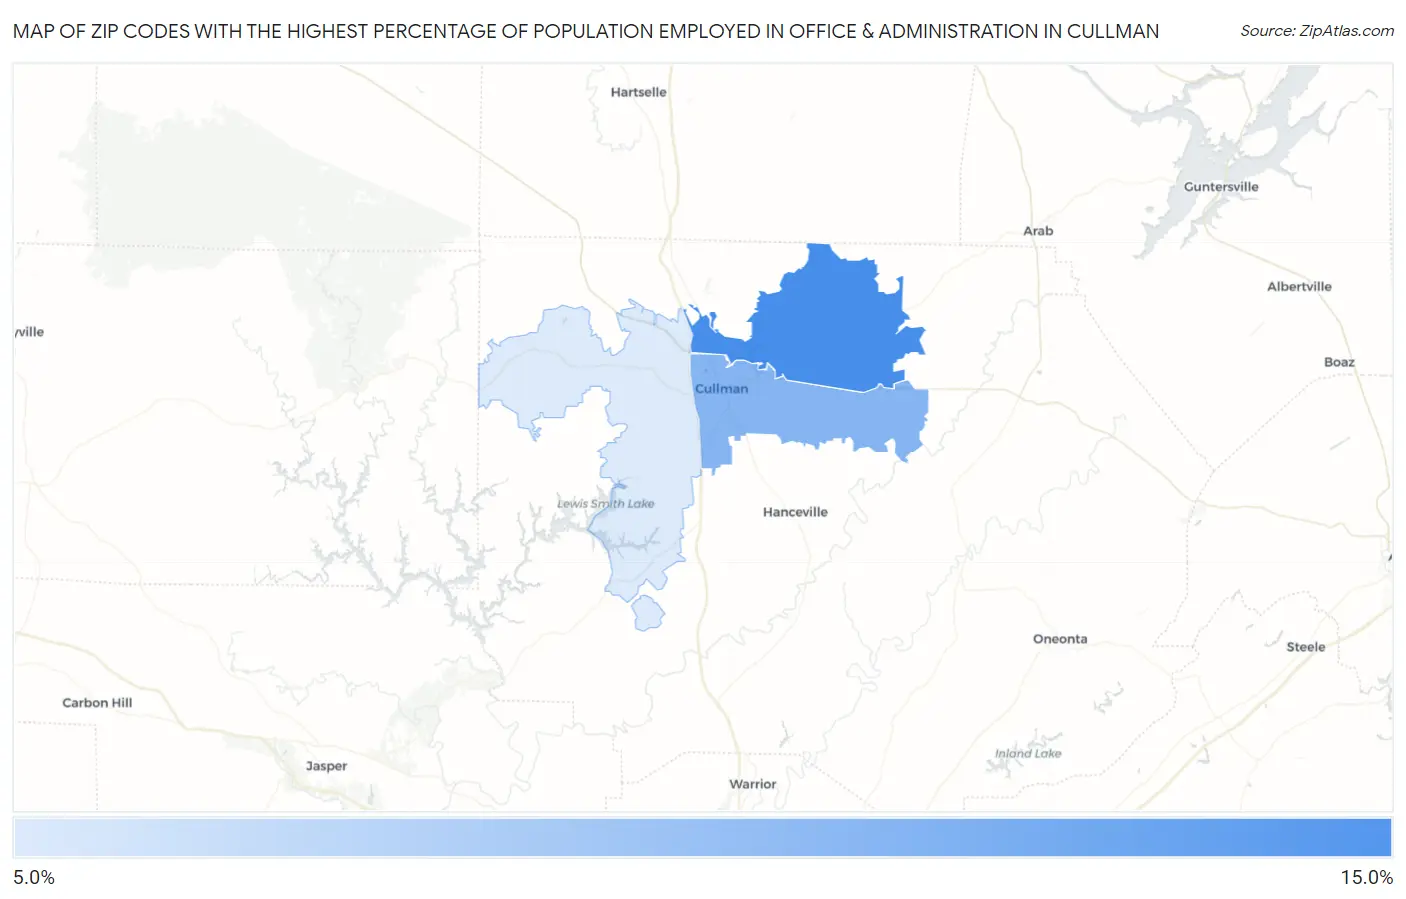
Map of Zip Codes with the Highest Percentage of Population Employed in Office & Administration in Cullman
9.1%
13.0%
Zip Codes with the Highest Percentage of Population Employed in Office & Administration in Cullman, AL
| Zip Code | % Employed | vs State | vs National | |
| 1. | 35058 | 13.0% | 10.7%(+2.32)#153 | 10.9%(+2.18)#7,986 |
| 2. | 35055 | 11.4% | 10.7%(+0.693)#229 | 10.9%(+0.554)#12,511 |
| 3. | 35057 | 9.1% | 10.7%(-1.60)#358 | 10.9%(-1.74)#19,898 |
1
Common Questions
What are the Top Zip Codes with the Highest Percentage of Population Employed in Office & Administration in Cullman, AL?
Top Zip Codes with the Highest Percentage of Population Employed in Office & Administration in Cullman, AL are:
What zip code has the Highest Percentage of Population Employed in Office & Administration in Cullman, AL?
35058 has the Highest Percentage of Population Employed in Office & Administration in Cullman, AL with 13.0%.
What is the Percentage of Population Employed in Office & Administration in Cullman, AL?
Percentage of Population Employed in Office & Administration in Cullman is 12.0%.
What is the Percentage of Population Employed in Office & Administration in Alabama?
Percentage of Population Employed in Office & Administration in Alabama is 10.7%.
What is the Percentage of Population Employed in Office & Administration in the United States?
Percentage of Population Employed in Office & Administration in the United States is 10.9%.