Zip Codes with the Highest Percentage of Population Employed in Accommodation & Food Services in Pell City, AL
RELATED REPORTS & OPTIONS
Accommodation & Food Services
Pell City
Compare Zip Codes
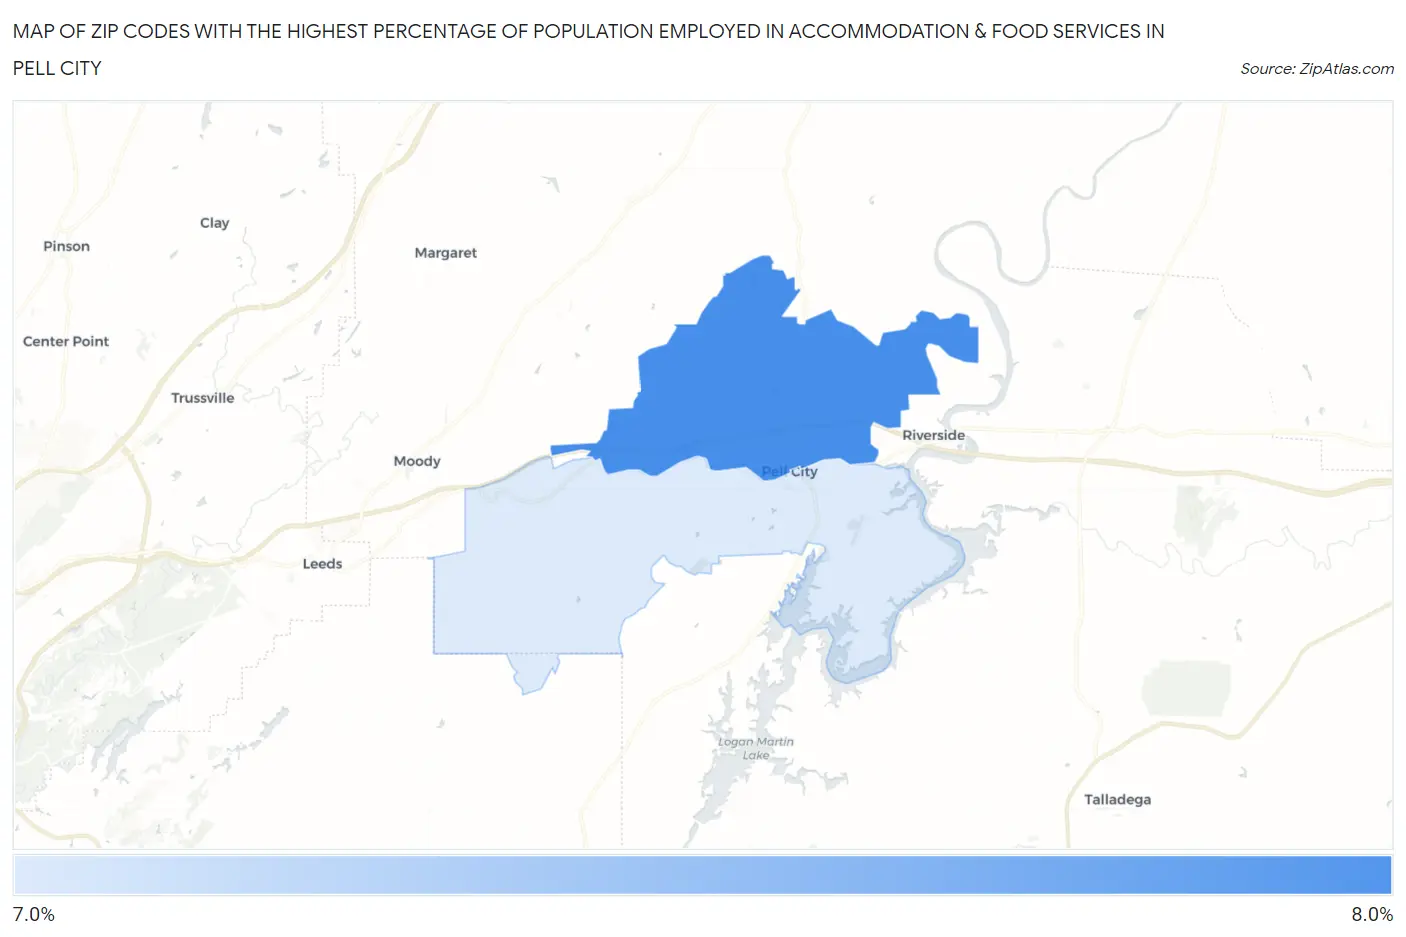
Map of Zip Codes with the Highest Percentage of Population Employed in Accommodation & Food Services in Pell City
7.4%
7.7%
Zip Codes with the Highest Percentage of Population Employed in Accommodation & Food Services in Pell City, AL
| Zip Code | % Employed | vs State | vs National | |
| 1. | 35125 | 7.7% | 6.9%(+0.830)#168 | 6.9%(+0.844)#8,430 |
| 2. | 35128 | 7.4% | 6.9%(+0.553)#184 | 6.9%(+0.566)#9,113 |
1
Common Questions
What are the Top Zip Codes with the Highest Percentage of Population Employed in Accommodation & Food Services in Pell City, AL?
Top Zip Codes with the Highest Percentage of Population Employed in Accommodation & Food Services in Pell City, AL are:
What zip code has the Highest Percentage of Population Employed in Accommodation & Food Services in Pell City, AL?
35125 has the Highest Percentage of Population Employed in Accommodation & Food Services in Pell City, AL with 7.7%.
What is the Percentage of Population Employed in Accommodation & Food Services in Pell City, AL?
Percentage of Population Employed in Accommodation & Food Services in Pell City is 10.5%.
What is the Percentage of Population Employed in Accommodation & Food Services in Alabama?
Percentage of Population Employed in Accommodation & Food Services in Alabama is 6.9%.
What is the Percentage of Population Employed in Accommodation & Food Services in the United States?
Percentage of Population Employed in Accommodation & Food Services in the United States is 6.9%.