Zip Codes with the Highest Percentage of Population Employed in Agriculture, Fishing & Hunting in Yonkers, NY

RELATED REPORTS & OPTIONS

Agriculture, Fishing & Hunting
Population
Families and Households
Female Fertility
Female Fertility (Unmarried)
Race (Community Size)
Race (Percentage)
Ancestry (Community Size)
AfricanAlbanianAmericanArabArgentineanArmenianAssyrian / Chaldean / SyriacAustrianBarbadianBelizeanBhutaneseBolivianBrazilianBritishBritish West IndianBurmeseCanadianCape VerdeanCentral AmericanCentral American IndianCherokeeChileanColombianCosta RicanCroatianCubanCzechCzechoslovakianDanishDominicanDutchEastern EuropeanEcuadorianEgyptianEnglishEthiopianEuropeanFilipinoFrenchFrench CanadianGermanGhanaianGreekGuatemalanGuyaneseHaitianHonduranHungarianIndian (Asian)IranianIrishIsraeliItalianJamaicanJordanianKoreanLebaneseLithuanianMacedonianMalteseMexicanMexican American IndianMoroccanNicaraguanNigerianNorwegianPakistaniPalestinianPanamanianPeruvianPolishPortuguesePuerto RicanRomanianRussianSalvadoranSamoanScotch-IrishScottishSerbianSlavicSlovakSouth AmericanSouth American IndianSpaniardSpanishSri LankanSubsaharan AfricanSwedishSwissSyrianThaiTrinidadian and TobagonianUkrainianUruguayanVenezuelanVietnameseWelshWest Indian
Ancestry (Percentage)
AfricanAlbanianAmericanArabArgentineanArmenianAssyrian / Chaldean / SyriacAustrianBarbadianBelizeanBhutaneseBolivianBrazilianBritishBritish West IndianBurmeseCanadianCape VerdeanCentral AmericanCentral American IndianCherokeeChileanColombianCosta RicanCroatianCubanCzechCzechoslovakianDanishDominicanDutchEastern EuropeanEcuadorianEgyptianEnglishEthiopianEuropeanFilipinoFrenchFrench CanadianGermanGhanaianGreekGuatemalanGuyaneseHaitianHonduranHungarianIndian (Asian)IranianIrishIsraeliItalianJamaicanJordanianKoreanLebaneseLithuanianMacedonianMalteseMexicanMexican American IndianMoroccanNicaraguanNigerianNorwegianPakistaniPalestinianPanamanianPeruvianPolishPortuguesePuerto RicanRomanianRussianSalvadoranSamoanScotch-IrishScottishSerbianSlavicSlovakSouth AmericanSouth American IndianSpaniardSpanishSri LankanSubsaharan AfricanSwedishSwissSyrianThaiTrinidadian and TobagonianUkrainianUruguayanVenezuelanVietnameseWelshWest Indian
Immigrant Origin (Total)
Immigrant Origin (Percentage)
Income
Income (Families)
Income (Households)
Poverty
Poverty (Families)
Unemployment
Employment Occupations
Employment Industries
Employer Class
Commute Time
Commute Means
School Enrollment
Education by Degree Field
Occupancy
Finances
Physical Characteristics
Yonkers
Compare Zip Codes
Comparison Subject

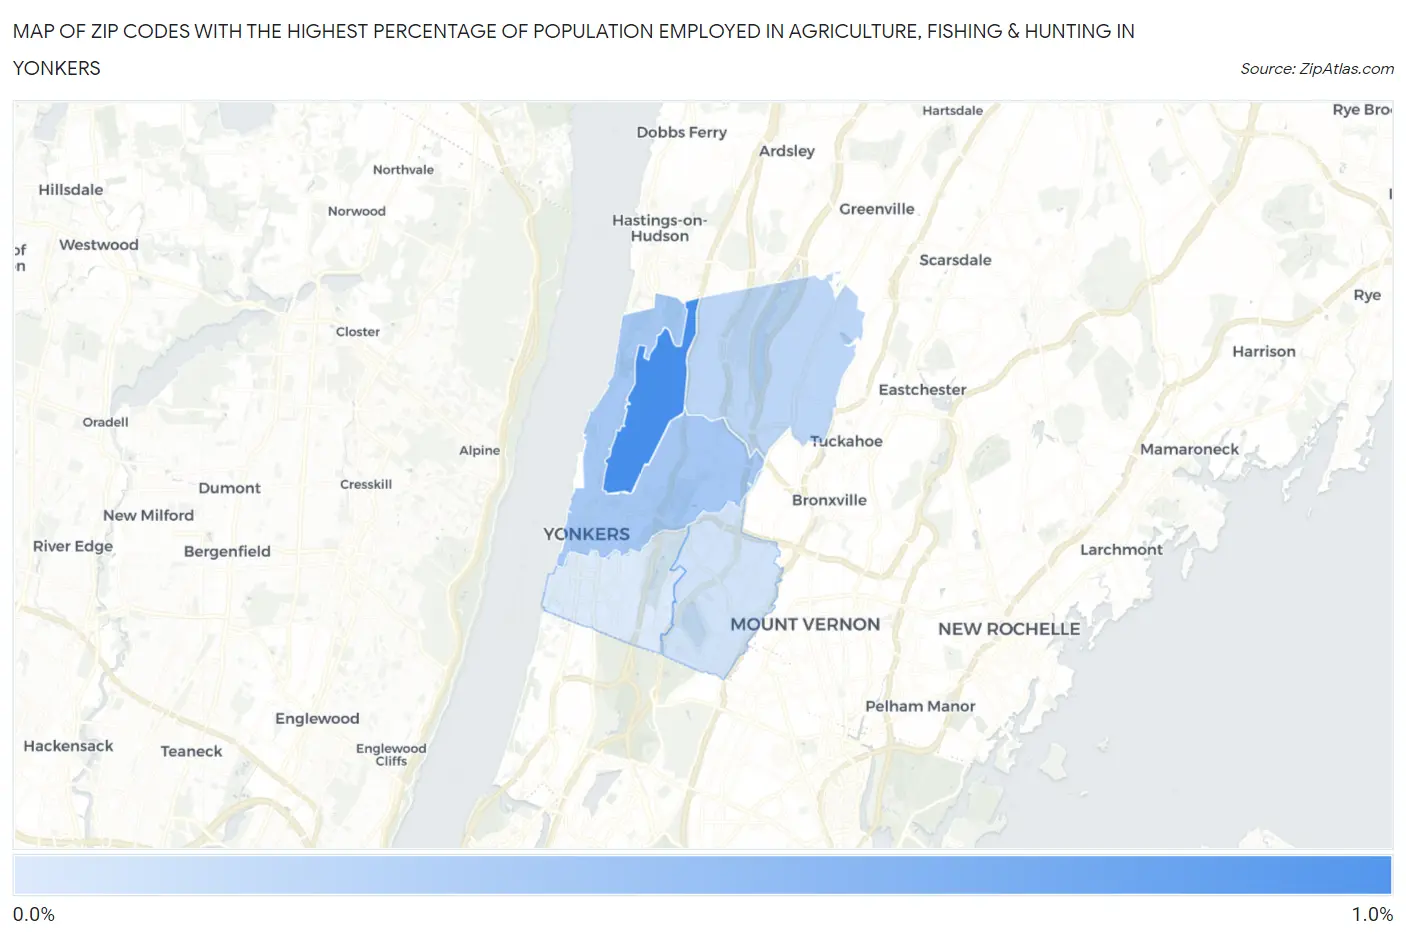
Map of Zip Codes with the Highest Percentage of Population Employed in Agriculture, Fishing & Hunting in Yonkers

0.0%
1.0%
Zip Codes with the Highest Percentage of Population Employed in Agriculture, Fishing & Hunting in Yonkers Map

Zip Codes with the Highest Percentage of Population Employed in Agriculture, Fishing & Hunting in Yonkers, NY

Zip Code % Employed vs State vs National
1.107030.82%0.50%(+0.317)#6641.2%(-0.382)#17,151
2.107010.36%0.50%(-0.136)#8261.2%(-0.836)#20,497
3.107100.24%0.50%(-0.256)#8931.2%(-0.955)#21,829
4.107040.14%0.50%(-0.357)#9721.2%(-1.06)#23,110
5.107050.092%0.50%(-0.408)#1,0241.2%(-1.11)#23,793

Common Questions

What are the Top 3 Zip Codes with the Highest Percentage of Population Employed in Agriculture, Fishing & Hunting in Yonkers, NY?
Top 3 Zip Codes with the Highest Percentage of Population Employed in Agriculture, Fishing & Hunting in Yonkers, NY are:
#1
0.82%
#2
0.36%
#3
0.24%
What zip code has the Highest Percentage of Population Employed in Agriculture, Fishing & Hunting in Yonkers, NY?
10703 has the Highest Percentage of Population Employed in Agriculture, Fishing & Hunting in Yonkers, NY with 0.82%.
What is the Percentage of Population Employed in Agriculture, Fishing & Hunting in Yonkers, NY?
Percentage of Population Employed in Agriculture, Fishing & Hunting in Yonkers is 0.30%.
What is the Percentage of Population Employed in Agriculture, Fishing & Hunting in New York?
Percentage of Population Employed in Agriculture, Fishing & Hunting in New York is 0.50%.
What is the Percentage of Population Employed in Agriculture, Fishing & Hunting in the United States?
Percentage of Population Employed in Agriculture, Fishing & Hunting in the United States is 1.2%.