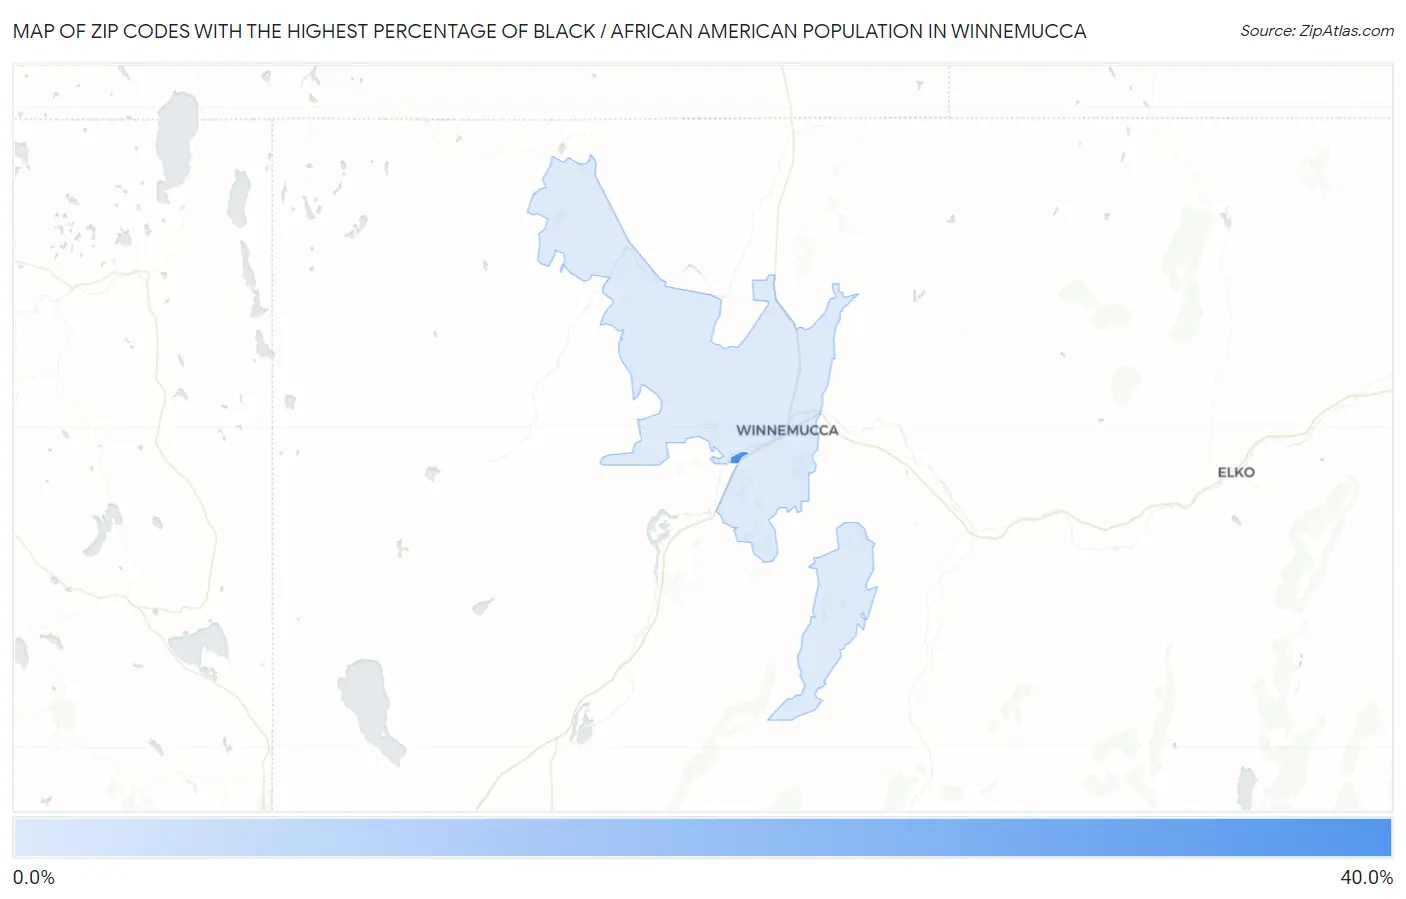
Zip Codes with the Highest Percentage of Black / African American Population in Winnemucca, NV
RELATED REPORTS & OPTIONS
Black / African American
Winnemucca
Compare Zip Codes
Map of Zip Codes with the Highest Percentage of Black / African American Population in Winnemucca
0.50%
38.7%
Zip Codes with the Highest Percentage of Black / African American Population in Winnemucca, NV
| Zip Code | Black / African American | vs State | vs National | |
| 1. | 89446 | 38.7% | 9.3%(+29.4)#2 | 12.5%(+26.3)#1,948 |
| 2. | 89445 | 0.50% | 9.3%(-8.84)#117 | 12.5%(-12.0)#19,077 |
1
Common Questions
What are the Top Zip Codes with the Highest Percentage of Black / African American Population in Winnemucca, NV?
Top Zip Codes with the Highest Percentage of Black / African American Population in Winnemucca, NV are:
What zip code has the Highest Percentage of Black / African American Population in Winnemucca, NV?
89446 has the Highest Percentage of Black / African American Population in Winnemucca, NV with 38.7%.
What is the Percentage of Black / African American Population in Winnemucca, NV?
Percentage of Black / African American Population in Winnemucca is 0.83%.
What is the Percentage of Black / African American Population in Nevada?
Percentage of Black / African American Population in Nevada is 9.3%.
What is the Percentage of Black / African American Population in the United States?
Percentage of Black / African American Population in the United States is 12.5%.