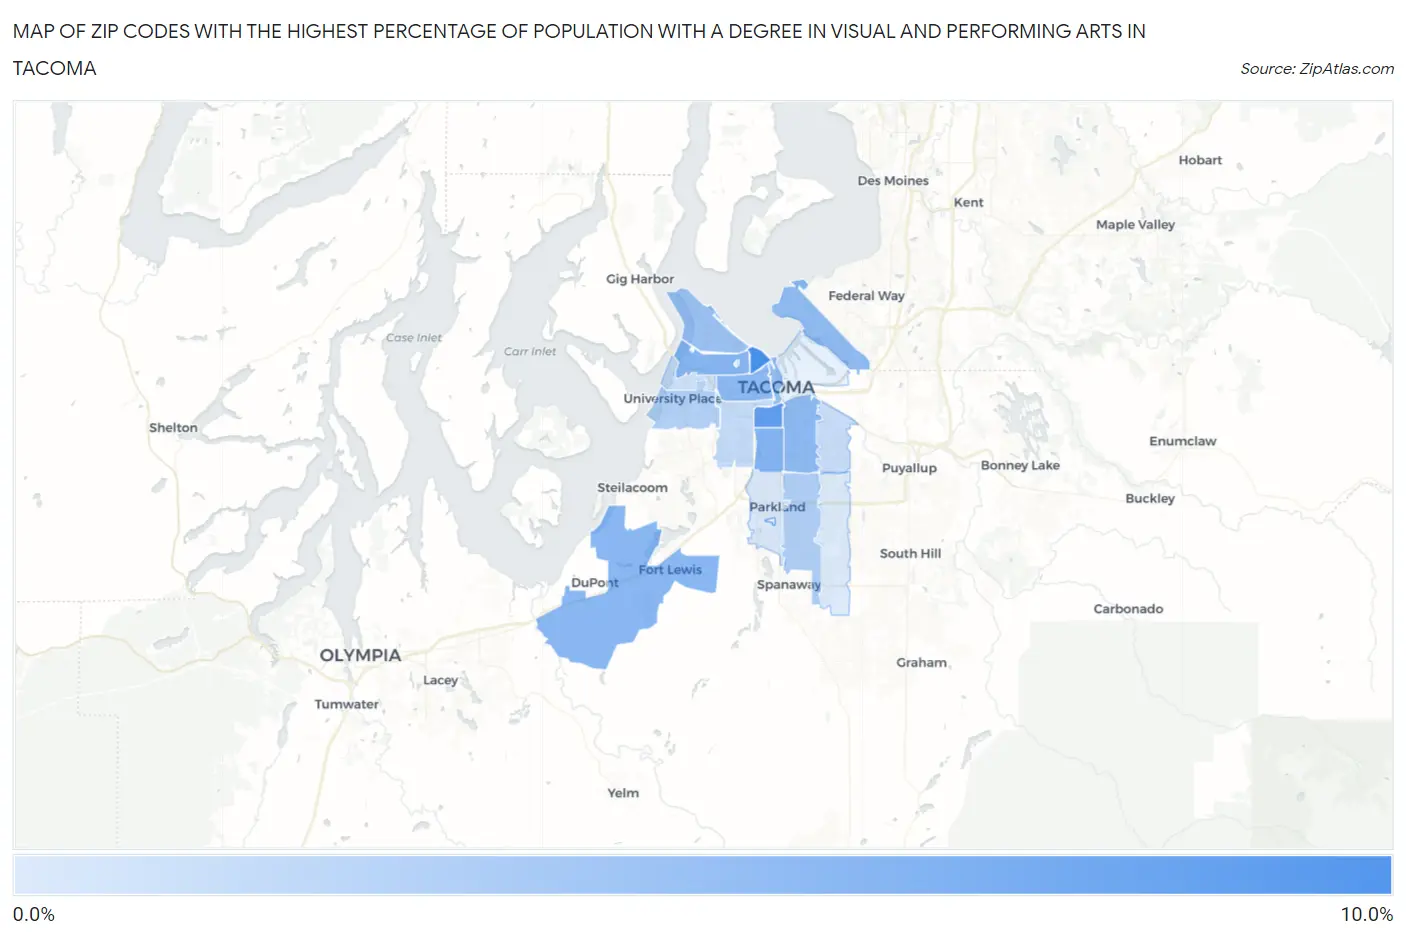
Zip Codes with the Highest Percentage of Population with a Degree in Visual and Performing Arts in Tacoma, WA
RELATED REPORTS & OPTIONS
Visual and Performing Arts
Tacoma
Compare Zip Codes
Map of Zip Codes with the Highest Percentage of Population with a Degree in Visual and Performing Arts in Tacoma
2.0%
9.0%
Zip Codes with the Highest Percentage of Population with a Degree in Visual and Performing Arts in Tacoma, WA
| Zip Code | % Graduates | vs State | vs National | |
| 1. | 98403 | 9.0% | 4.6%(+4.34)#54 | 4.3%(+4.70)#2,280 |
| 2. | 98418 | 7.7% | 4.6%(+3.13)#73 | 4.3%(+3.49)#3,023 |
| 3. | 98408 | 6.0% | 4.6%(+1.43)#120 | 4.3%(+1.80)#4,808 |
| 4. | 98406 | 5.9% | 4.6%(+1.25)#128 | 4.3%(+1.62)#5,065 |
| 5. | 98433 | 5.8% | 4.6%(+1.17)#131 | 4.3%(+1.53)#5,192 |
| 6. | 98404 | 5.5% | 4.6%(+0.926)#145 | 4.3%(+1.29)#5,603 |
| 7. | 98405 | 5.5% | 4.6%(+0.913)#148 | 4.3%(+1.28)#5,624 |
| 8. | 98422 | 5.4% | 4.6%(+0.826)#158 | 4.3%(+1.19)#5,772 |
| 9. | 98402 | 5.2% | 4.6%(+0.597)#164 | 4.3%(+0.964)#6,211 |
| 10. | 98407 | 5.1% | 4.6%(+0.451)#169 | 4.3%(+0.818)#6,483 |
| 11. | 98445 | 4.1% | 4.6%(-0.507)#235 | 4.3%(-0.140)#8,898 |
| 12. | 98466 | 3.8% | 4.6%(-0.785)#250 | 4.3%(-0.418)#9,779 |
| 13. | 98409 | 3.1% | 4.6%(-1.49)#308 | 4.3%(-1.12)#12,229 |
| 14. | 98443 | 2.9% | 4.6%(-1.71)#329 | 4.3%(-1.34)#13,054 |
| 15. | 98465 | 2.6% | 4.6%(-2.05)#355 | 4.3%(-1.68)#14,373 |
| 16. | 98444 | 2.1% | 4.6%(-2.52)#370 | 4.3%(-2.16)#16,083 |
| 17. | 98446 | 2.0% | 4.6%(-2.63)#381 | 4.3%(-2.26)#16,487 |
1
Common Questions
What are the Top 10 Zip Codes with the Highest Percentage of Population with a Degree in Visual and Performing Arts in Tacoma, WA?
Top 10 Zip Codes with the Highest Percentage of Population with a Degree in Visual and Performing Arts in Tacoma, WA are:
What zip code has the Highest Percentage of Population with a Degree in Visual and Performing Arts in Tacoma, WA?
98403 has the Highest Percentage of Population with a Degree in Visual and Performing Arts in Tacoma, WA with 9.0%.
What is the Percentage of Population with a Degree in Visual and Performing Arts in Tacoma, WA?
Percentage of Population with a Degree in Visual and Performing Arts in Tacoma is 5.3%.
What is the Percentage of Population with a Degree in Visual and Performing Arts in Washington?
Percentage of Population with a Degree in Visual and Performing Arts in Washington is 4.6%.
What is the Percentage of Population with a Degree in Visual and Performing Arts in the United States?
Percentage of Population with a Degree in Visual and Performing Arts in the United States is 4.3%.