Zip Codes with the Highest Percentage of Population with a Degree in Visual and Performing Arts in Bellevue, WA
RELATED REPORTS & OPTIONS
Visual and Performing Arts
Bellevue
Compare Zip Codes
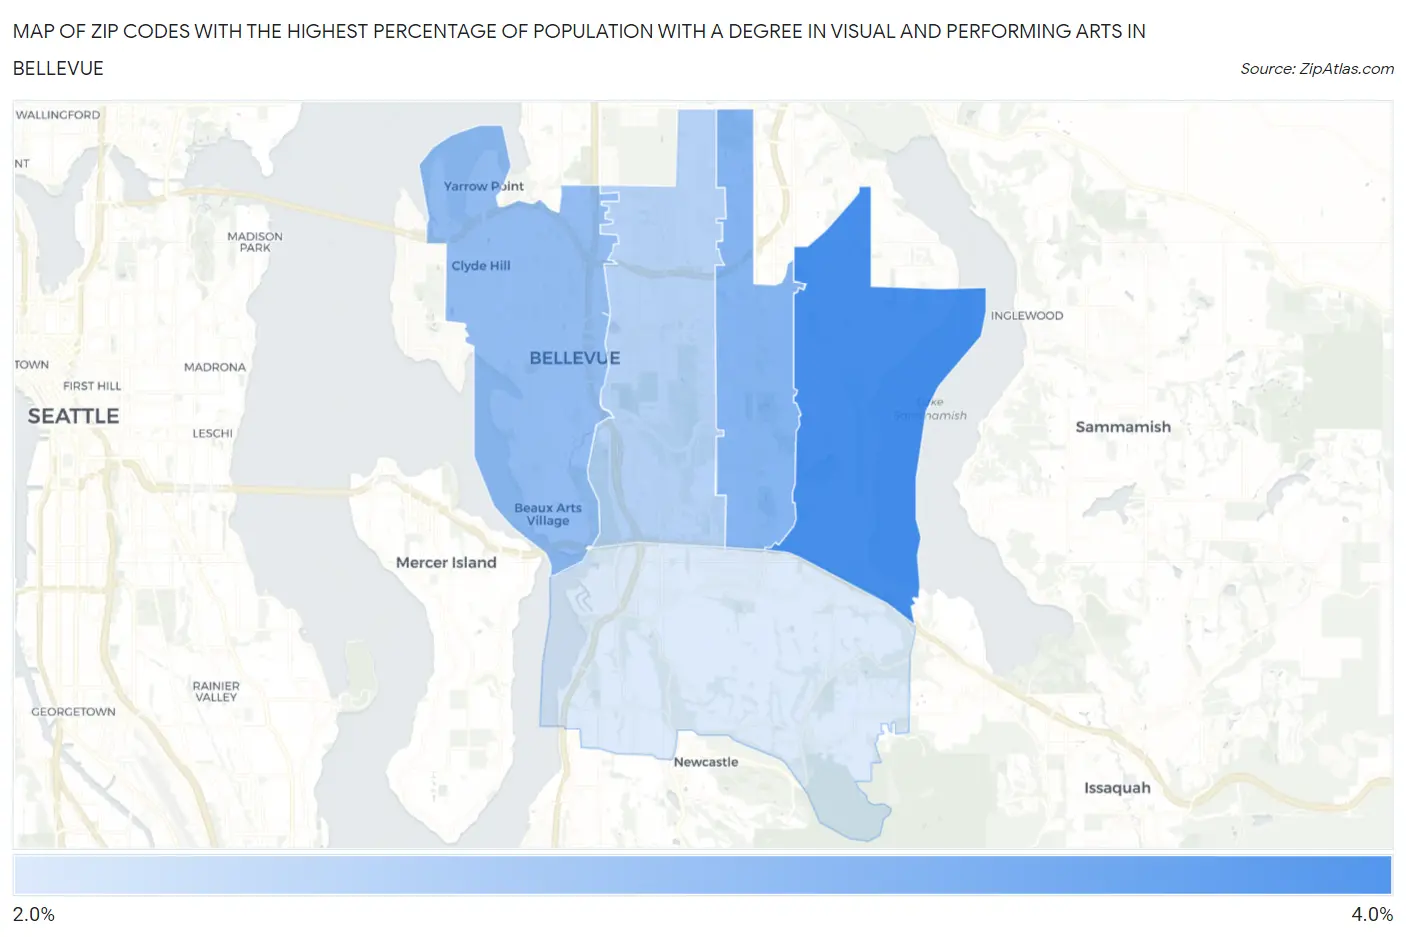
Map of Zip Codes with the Highest Percentage of Population with a Degree in Visual and Performing Arts in Bellevue
2.5%
3.8%
Zip Codes with the Highest Percentage of Population with a Degree in Visual and Performing Arts in Bellevue, WA
| Zip Code | % Graduates | vs State | vs National | |
| 1. | 98008 | 3.8% | 4.6%(-0.866)#254 | 4.3%(-0.499)#9,997 |
| 2. | 98007 | 3.2% | 4.6%(-1.37)#299 | 4.3%(-1.01)#11,826 |
| 3. | 98004 | 3.1% | 4.6%(-1.49)#309 | 4.3%(-1.13)#12,241 |
| 4. | 98005 | 2.8% | 4.6%(-1.79)#339 | 4.3%(-1.42)#13,364 |
| 5. | 98006 | 2.5% | 4.6%(-2.10)#356 | 4.3%(-1.74)#14,560 |
1
Common Questions
What are the Top 3 Zip Codes with the Highest Percentage of Population with a Degree in Visual and Performing Arts in Bellevue, WA?
Top 3 Zip Codes with the Highest Percentage of Population with a Degree in Visual and Performing Arts in Bellevue, WA are:
What zip code has the Highest Percentage of Population with a Degree in Visual and Performing Arts in Bellevue, WA?
98008 has the Highest Percentage of Population with a Degree in Visual and Performing Arts in Bellevue, WA with 3.8%.
What is the Percentage of Population with a Degree in Visual and Performing Arts in Bellevue, WA?
Percentage of Population with a Degree in Visual and Performing Arts in Bellevue is 3.0%.
What is the Percentage of Population with a Degree in Visual and Performing Arts in Washington?
Percentage of Population with a Degree in Visual and Performing Arts in Washington is 4.6%.
What is the Percentage of Population with a Degree in Visual and Performing Arts in the United States?
Percentage of Population with a Degree in Visual and Performing Arts in the United States is 4.3%.